SEVEN GATES RESEARCH · ESSAY
Nigeria GDP Growth 2026: Why 4.43% Is Not Enough to Lift Nigerians Out of Poverty
Nigeria’s economy is growing again, but is 4.43% enough? A 47-year view of GDP per person, poverty, productive jobs and the reforms needed for lasting prosperity.
Sexy Data and Empty Pockets
Nigeria’s race against the denominator, from 1978 to 2026
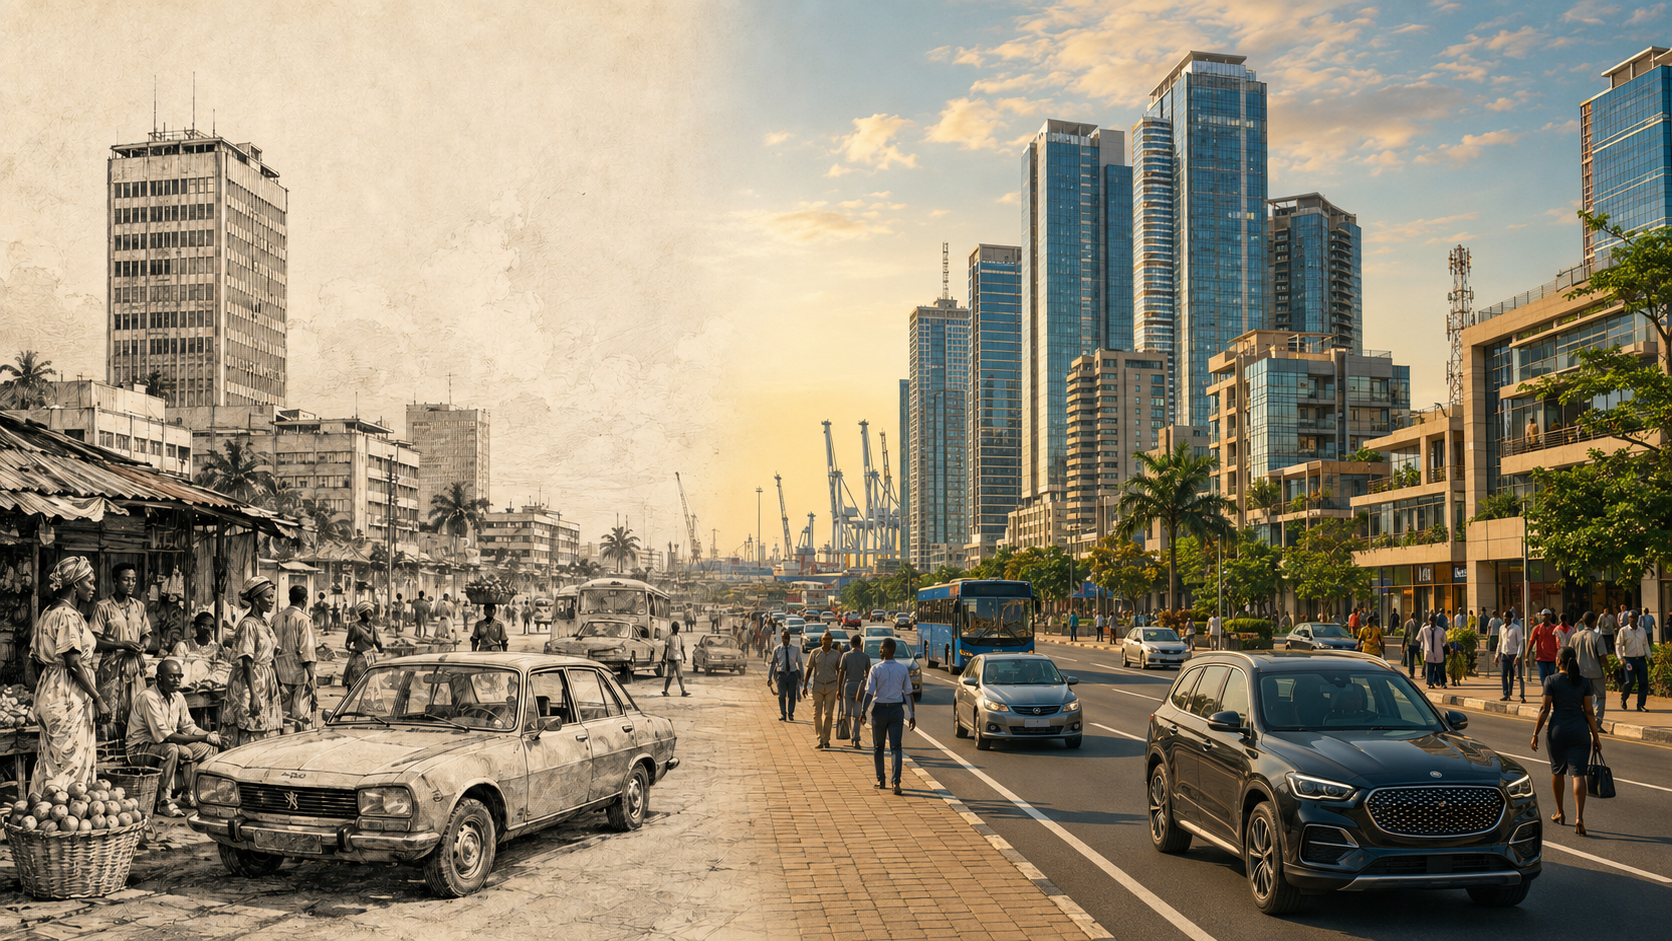
Lagos, across two eras. Editorial illustration, not an archival photograph.
In 1978, Nigeria had about 69 million people and the confidence of a man who had recently discovered that his uncle owned the bank. Oil money was financing roads, airports, universities and industrial ambitions. A new federal capital was already in the making. The country intended to be taken seriously, and was ordering the concrete to prove it.
By 2025, the population had reached roughly 238 million. Military rule had come and gone; democracy had returned; GSM had made the telephone ordinary; Nollywood had acquired an audience across the continent. Nigeria had built large banks, a technology industry and rather more skylines than its electricity system could comfortably support.
Real output per Nigerian had risen from about $2,083 to $2,369, measured in constant 2015 dollars. That is an increase of approximately 14% in forty-seven years, or 0.27% a year. These are estimates of production per person, not household earnings, but the scale of the disappointment survives the distinction. World Bank: real GDP per capita, population.
Nigeria did grow. The denominator kept growing with it. The national achievement has been considerable; the average economic increment has been remarkably small.
The Seven Gates view
The 4.43% Q2 2026 growth figure is welcome evidence of recovery. Sustained at that pace, with population expanding by 2.1% annually, it would imply roughly 2.3% growth in real output per person. Nigeria needs faster productivity growth, better work and a much longer run of policy consistency. Its own history shows both that this is possible and how much repeated interruption costs.
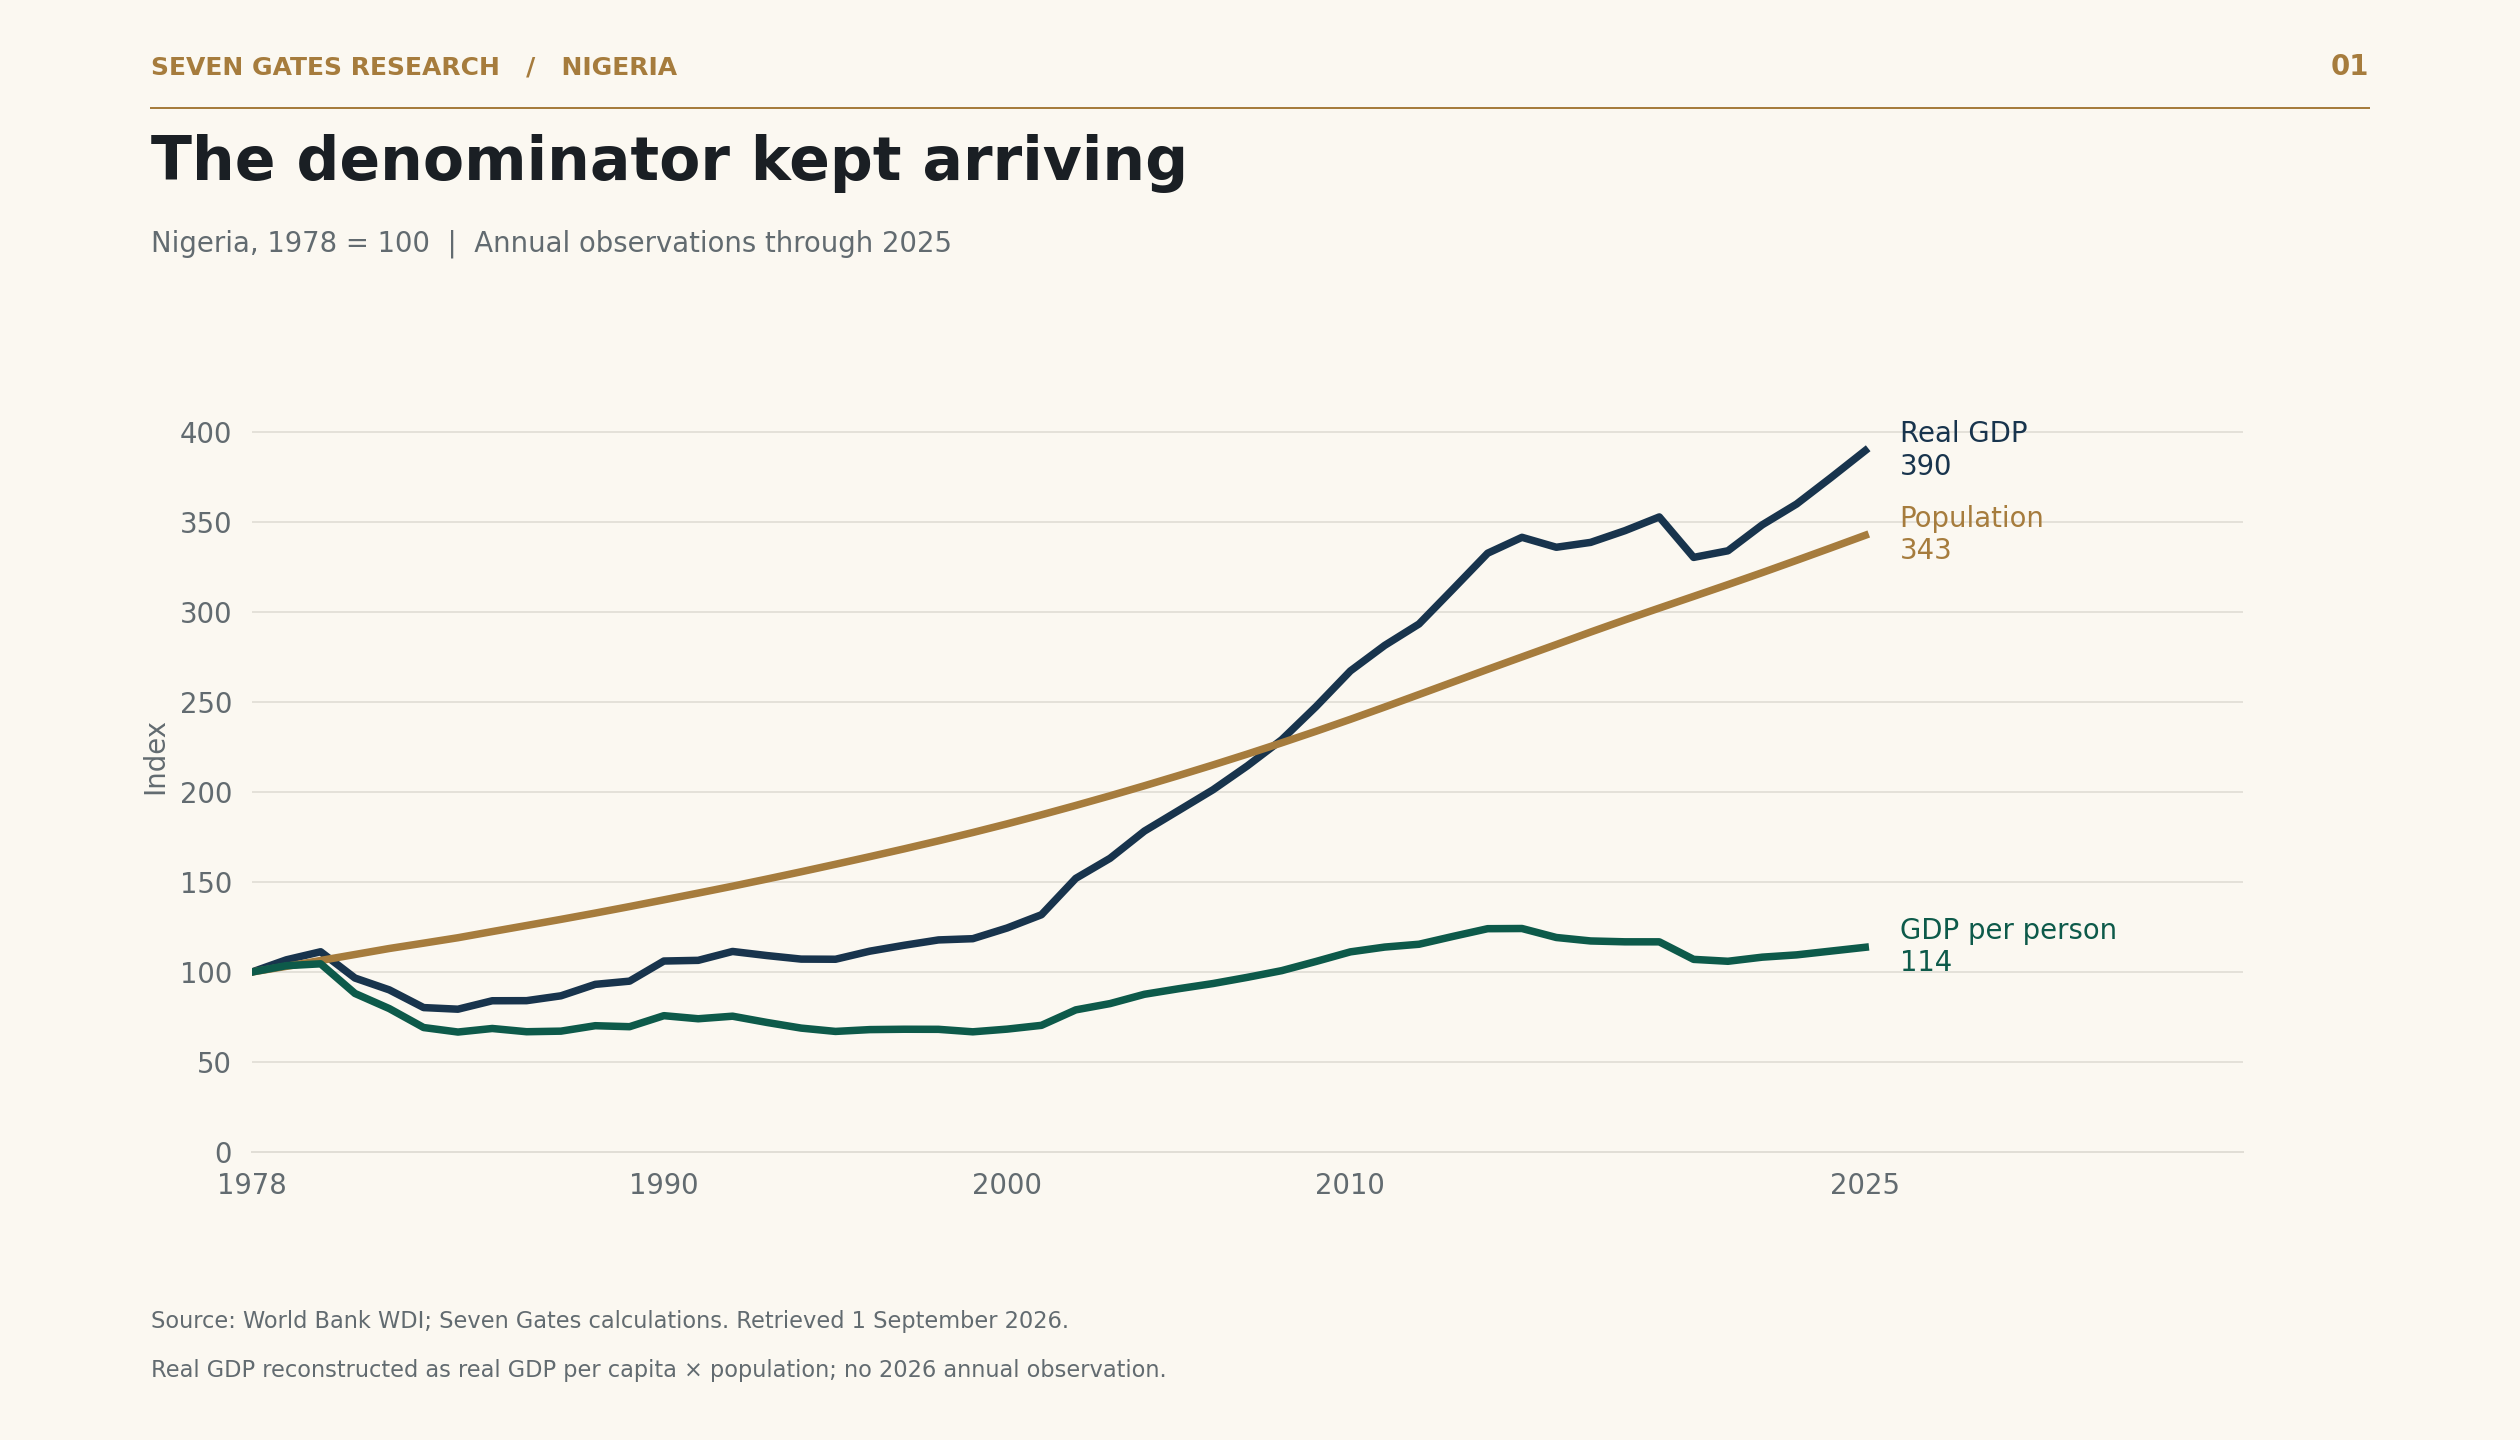
Total output expanded almost fourfold. Output per person rose by only about 14%. Annual history ends in 2025.
GDP is not everything. It is still rather useful.
The strongest objection to GDP is straightforward: it cannot tell us whether a child can read, a hospital has oxygen or the road from Lokoja has abandoned civil engineering and returned to geology. It says little about who receives the income. A country can produce a great deal while many of its citizens remain poor.
That objection establishes the need for more measures. It does not make production optional. A country of nearly a quarter-billion people cannot provide better housing, healthcare, education, transport and power indefinitely from a stagnant productive base. Redistribution can improve lives now; sustained increases in productivity enlarge what can be distributed tomorrow.
The useful question is whether output is rising quickly enough, across enough activities and for long enough, to expand the choices available to Nigerians.
Nigeria’s economy grew 4.43% year on year in Q2 2026, compared with 3.89% in Q1, according to the NBS release reported on 31 August. These are real growth rates, already adjusted for changes in prices. The improvement deserves recognition. It is not evidence that the development assignment has been completed. NBS GDP publications, Reuters, 31 August 2026.
Consider a deliberately simple illustration. If annual real GDP growth stayed at 4.43% and population growth stayed at 2.1%, the implied annual increase in real GDP per person would be:
(1.0443 ÷ 1.021) − 1 = 2.28%.
At that rate, real output per person doubles in about 31 years. A Nigerian entering working life today would be well into middle age before the average economic slice doubled. That is progress, but it is a leisurely interpretation of urgency.
The calculation is a scenario, not a forecast. A year-on-year quarterly release is not a promise about the next thirty years, and population growth will change. Its purpose is to show why the denominator belongs in every serious discussion of Nigeria’s growth.
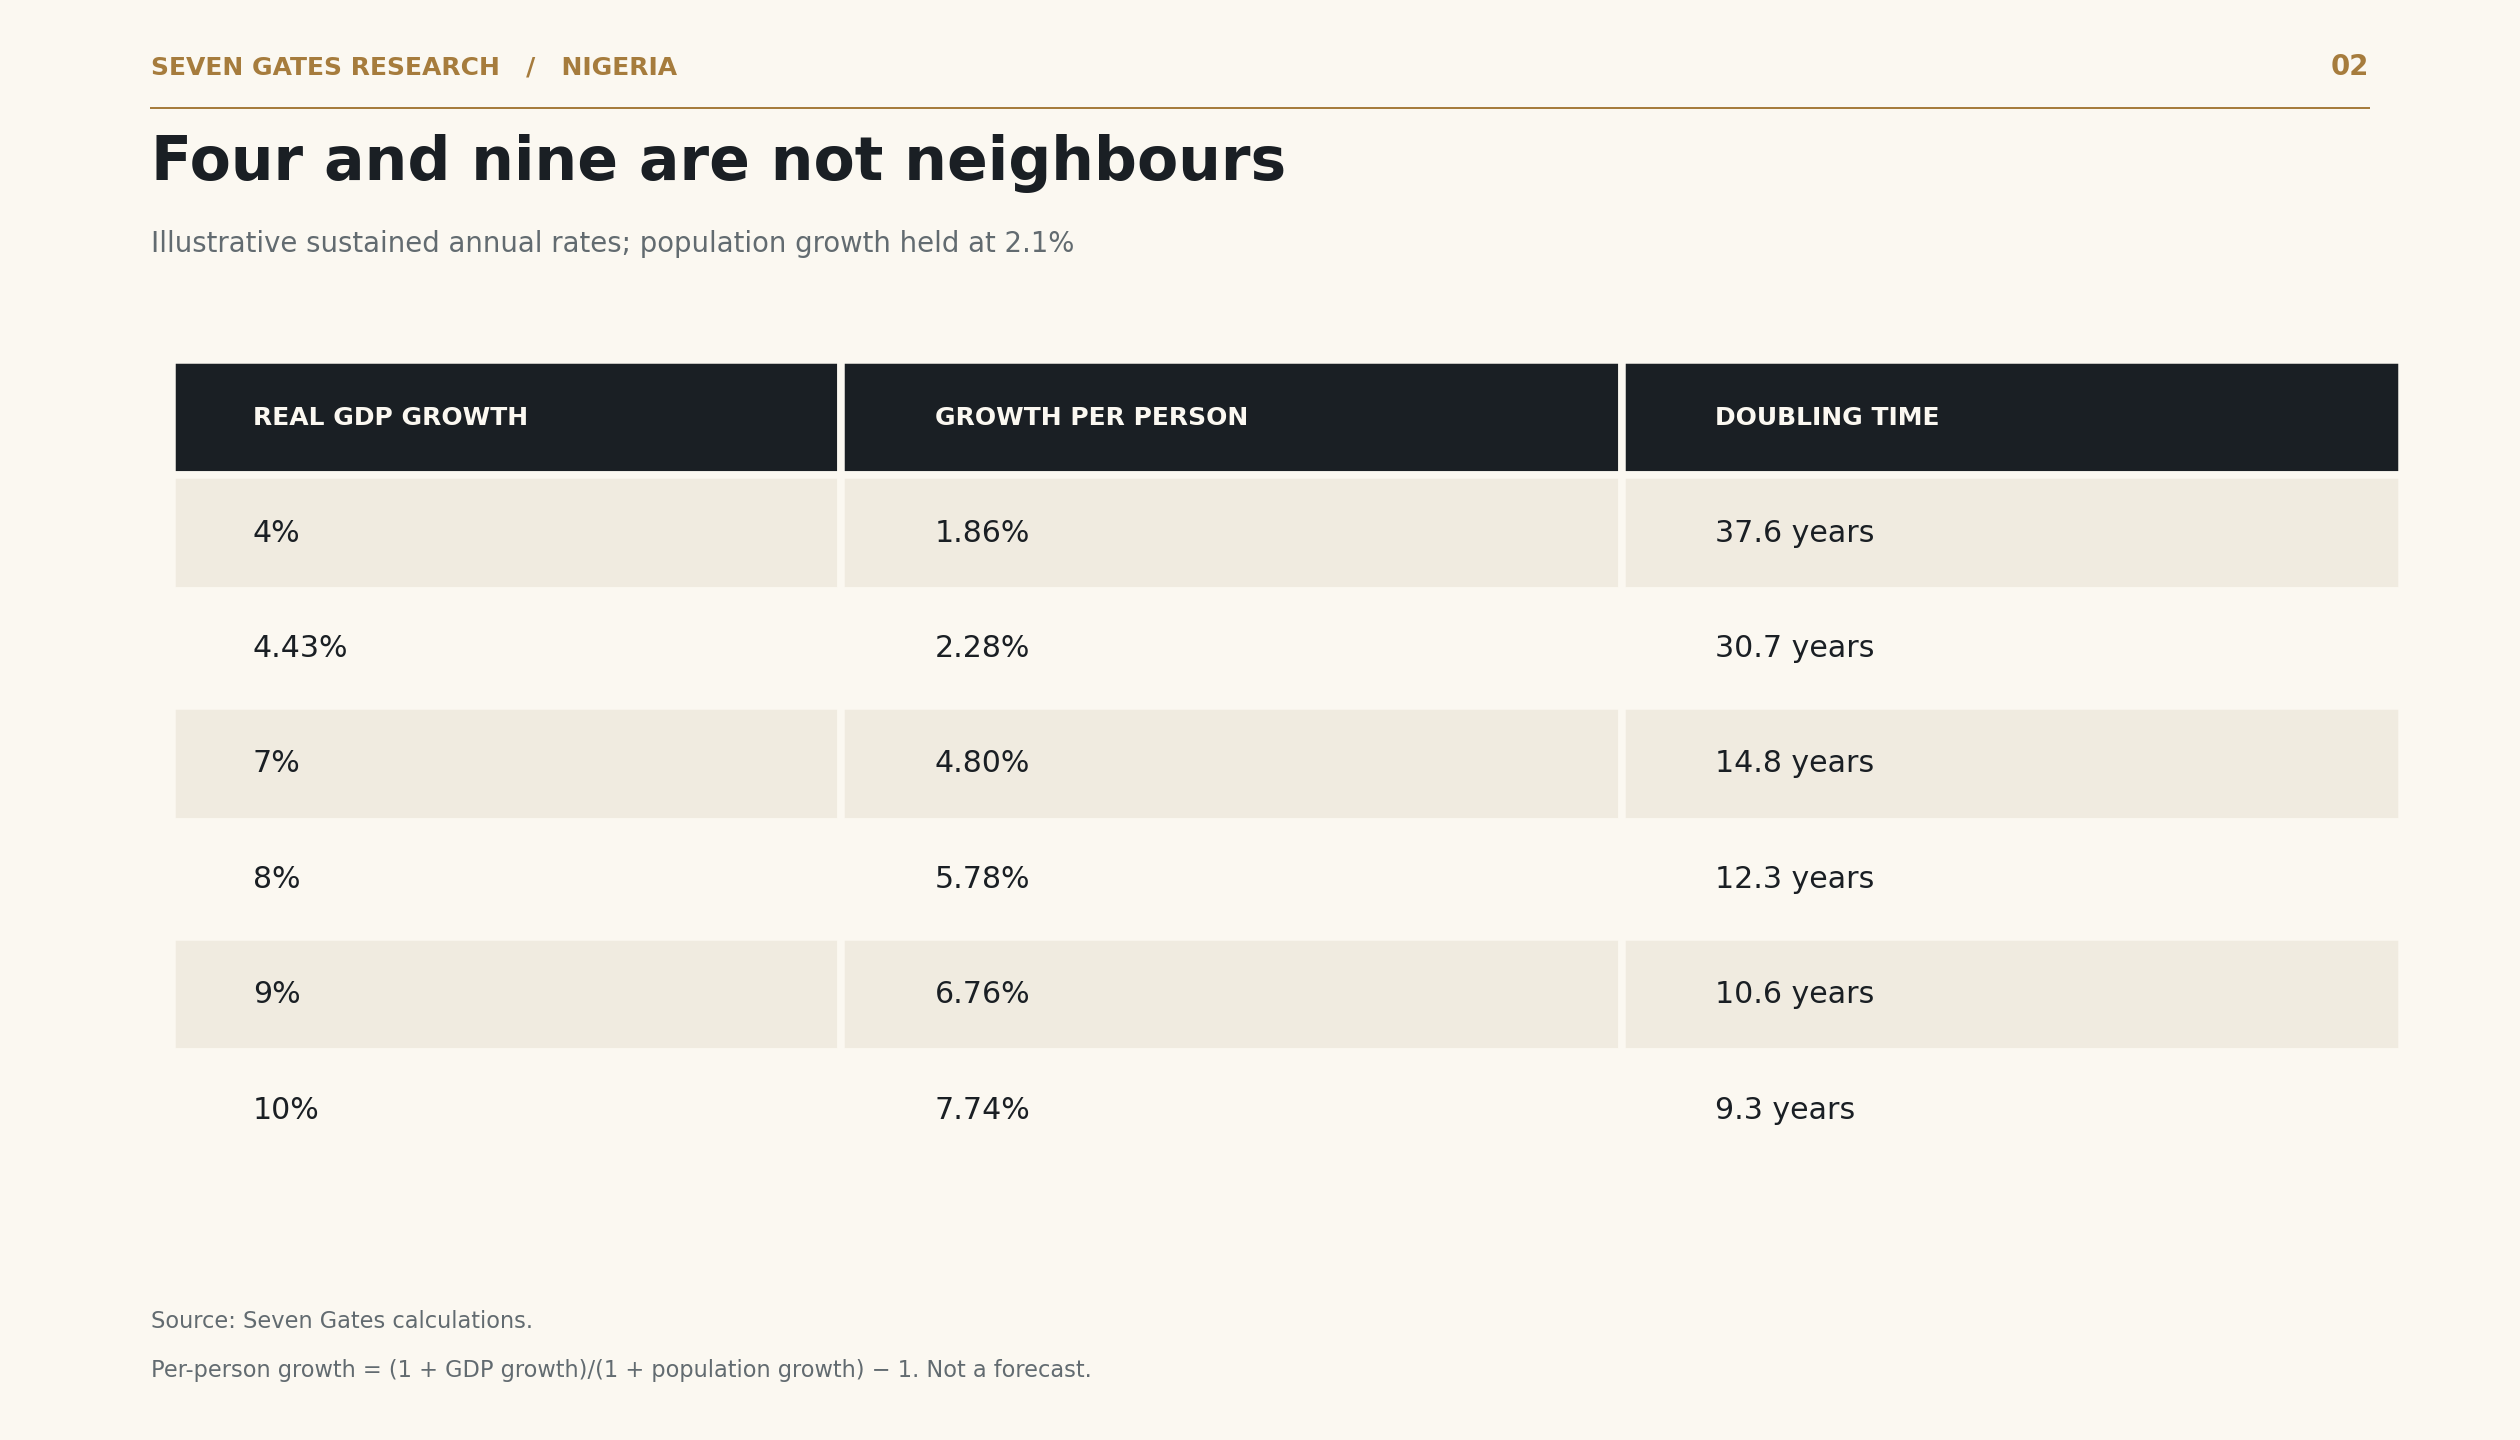
Read exhibit 2 as a table
| gdp growth | per capita growth | doubling time |
|---|---|---|
| 4% | 1.86% | 37.6 years |
| 4.43% | 2.28% | 30.7 years |
| 7% | 4.80% | 14.8 years |
| 8% | 5.78% | 12.3 years |
| 9% | 6.76% | 10.6 years |
| 10% | 7.74% | 9.3 years |
At 4.43% sustained GDP growth, real output per person doubles in about 31 years.
The arithmetic uses a constant 2.1% population-growth assumption. Doubling times are calculated with logarithms, not rounded rules of thumb.
The trillion-dollar appointment
Picture a Lokoja hotelier arriving at his bank with a plan to nearly triple turnover in four years. The manager starts counting rooms; the hotelier starts naming dignitaries for the opening ceremony. Taiwo Oyedele’s trillion-dollar ambition deserves the manager’s questions. In the Finance Ministry’s 1 September statement, reported by The Guardian, stronger growth and a firmer naira underpin the case for reaching $1 trillion by 2030. The direction has improved; the timetable remains formidable. Starting from the IMF’s $377.365 billion estimate for 2026, reproduced by Türkiye’s Ministry of Trade, Nigeria must expand dollar GDP 2.65 times in four annual steps: 27.6% compounded every year. Even extending the ministry’s reported 17% year-on-year dollar increase as an annual rate would produce only $707 billion in 2030. That H1 comparison covers a year; it cannot be compounded twice as though it were six-month growth.
Crucially, 27.6% dollar growth is not a requirement for 27.6% real growth. The dollar total also changes with Nigerian prices and the exchange rate. Allow an illustrative 10% annual rise in the GDP deflator, the economy-wide price measure rather than consumer inflation, and hold the naira steady: sustained 3–5% real growth delivers roughly $622–672 billion by 2030. Even 8% reaches only $752 billion. Hitting the trillion under those assumptions requires 16.0% real growth every year; with 5% annual naira depreciation, the requirement rises to 21.8%. A stronger currency or higher domestic prices can lower that real-growth hurdle, but a larger dollar headline does not itself establish better living standards. The hotel still needs paying guests. For prosperity to keep the appointment, Nigeria needs a sustained surge in productive investment, dependable power, secure farms, efficient ports and competitive exports capable of supporting the currency. That is years of difficult execution across the economy, with little room for reversal before 2030. Verdict: an ambitious, conditionally achievable target; “on track” is not established by the latest growth release.
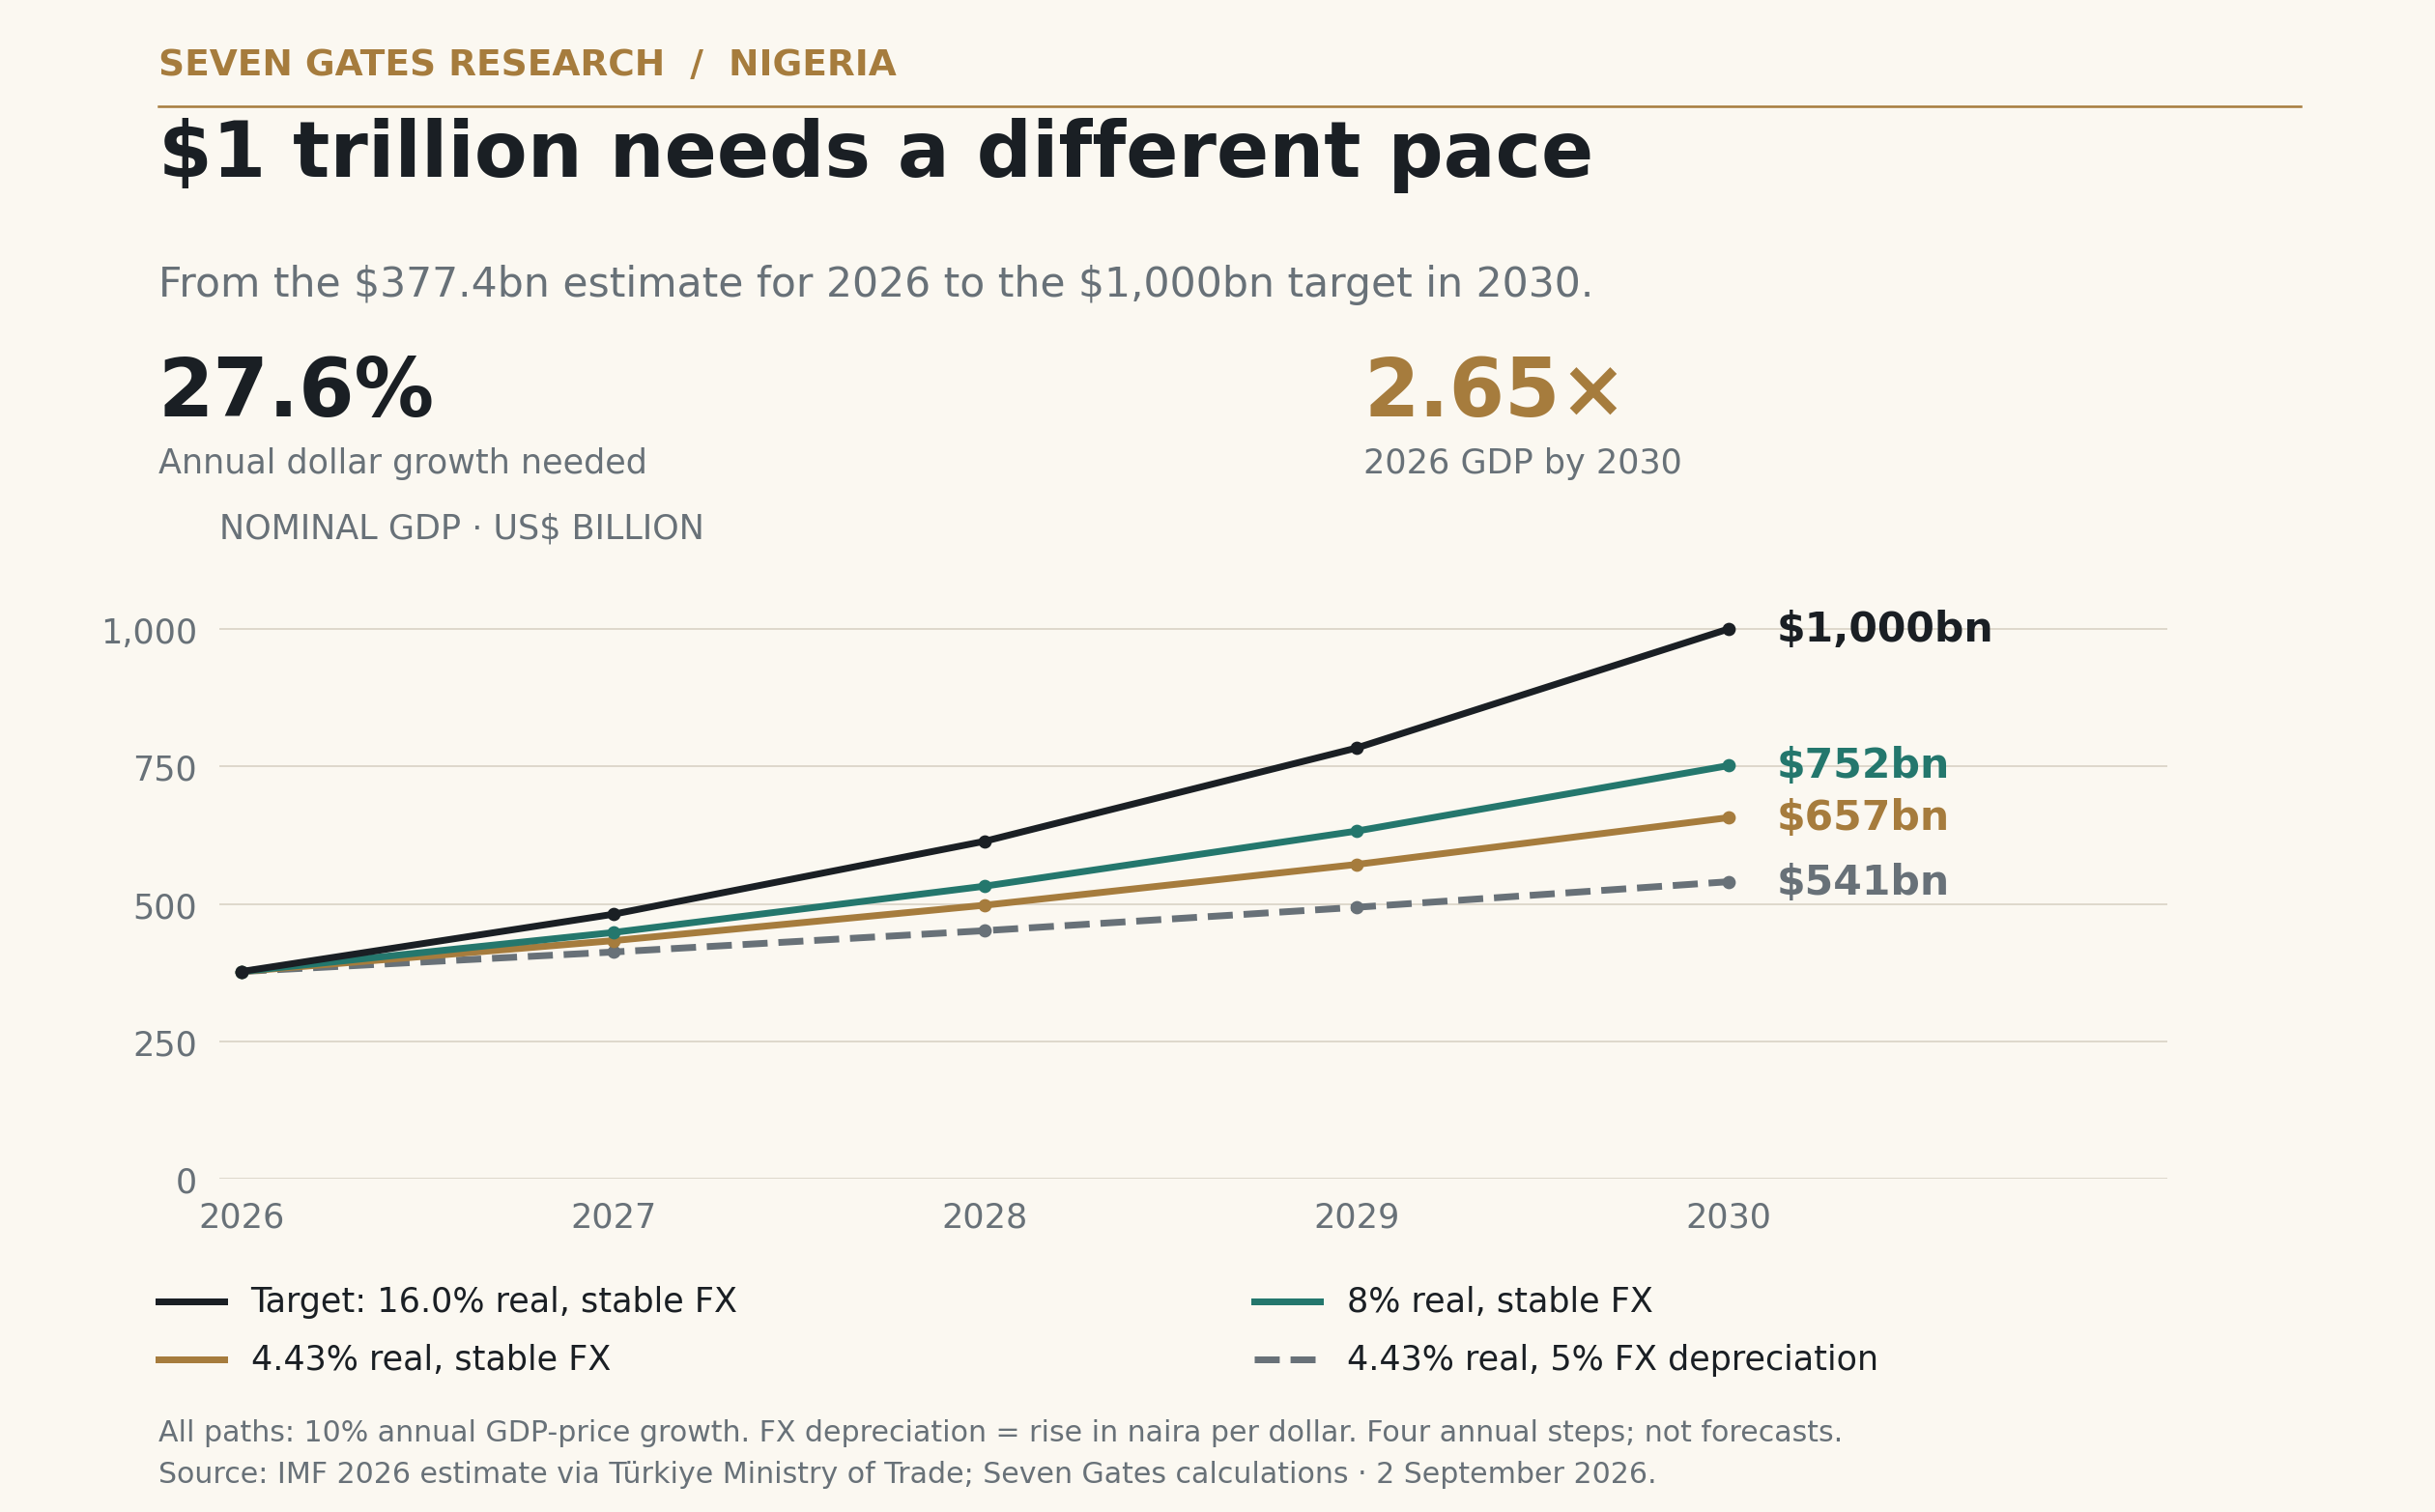
Read the trillion-dollar arithmetic and assumptions
Illustrative annual rates in 2027–2030, from a $377.365bn full-year 2026 estimate. Every row assumes a 10% annual GDP deflator.
| Real growth | Naira per dollar | Dollar GDP growth | 2030 GDP |
|---|---|---|---|
| 3.00% | Unchanged | 13.30% | $622bn |
| 4.43% | Unchanged | 14.87% | $657bn |
| 5.00% | Unchanged | 15.50% | $672bn |
| 8.00% | Unchanged | 18.80% | $752bn |
| 4.43% | Rises 5% a year | 9.40% | $541bn |
| 15.989% required | Unchanged | 27.588% | $1,000bn |
| 21.788% required | Rises 5% a year | 27.588% | $1,000bn |
Method: dollar GDP growth = (1 + real growth) × (1 + GDP-deflator growth) ÷ (1 + change in naira per dollar) − 1. Required annual dollar growth = (1,000 ÷ 377.365)1/4 − 1. The GDP level is nominal at current exchange rates, not purchasing-power parity. A higher naira-per-dollar rate means depreciation. All paths use consistent annual-average conversion rates, compound across four annual intervals and exclude future rebasing or coverage revisions. The 2026 starting level is an estimate, not a completed-year observation; 4.43% is a quarterly year-on-year result used here only as a hypothetical sustained annual rate.
Sensitivity: a $350–400bn starting level would require 30.0–25.7% annual dollar growth. At 4.43% real growth and a 10% deflator, reaching the target would instead require naira per dollar to fall about 10.0% every year. Holding the exchange rate steady while domestic prices rise is itself a demanding assumption. These are accounting scenarios, not forecasts, a recommended inflation policy or an independently validated estimate of the ministry’s reported 17% increase.
Sources: IMF WEO, April 2026: current-dollar GDP, with the $377.365bn figure checked against Türkiye’s Ministry of Trade; Oyedele statement, reported 2 September 2026; Seven Gates calculations. Download the chart’s annual values (CSV).
Three GDPs walk into a political argument
Ask whether Nigeria’s GDP has collapsed and you can receive three different answers, each referring to a different measure.
Real GDP describes the volume of production after removing price changes. Nigeria produces more in aggregate than it did in 2014. The economy did not lose half its farms, factories, banks and telecommunications networks because a dollar league table became less flattering.
GDP in current US dollars is a different object. On the World Bank series used here, Nigeria’s nominal dollar GDP was roughly $574 billion in 2014, $252 billion in 2024 and $291 billion in 2025. Exchange-rate translation matters enormously, alongside domestic prices and changes in measurement. World Bank: current-dollar GDP.
For illustration, hold naira output at ₦100 trillion. At ₦160 to the dollar it translates to $625 billion; at ₦1,500 it becomes about $67 billion. Nothing in that calculation requires a factory to close. It is an accounting example, not a reconstruction of what actually happened, because naira output and domestic prices did not stand still.
Depreciation nevertheless has real consequences. Imported machinery becomes dearer, foreign debt becomes harder to service and purchasing power over foreign goods falls. Dollar GDP matters. It simply cannot answer every question about domestic welfare.
Real GDP per person is where Nigeria’s lost ground becomes harder to explain away. It climbed from about $1,422 in 2000 to $2,584 in 2014, edged to a peak of $2,586 in 2015, then declined. The 2025 figure of $2,369 remained approximately 8.3% below 2014 and 8.4% below 2015. World Bank: real GDP per capita.
The country became larger without making the average Nigerian proportionately richer. Household consumption, real wages and poverty complete that account; a ranking against Egypt does not.
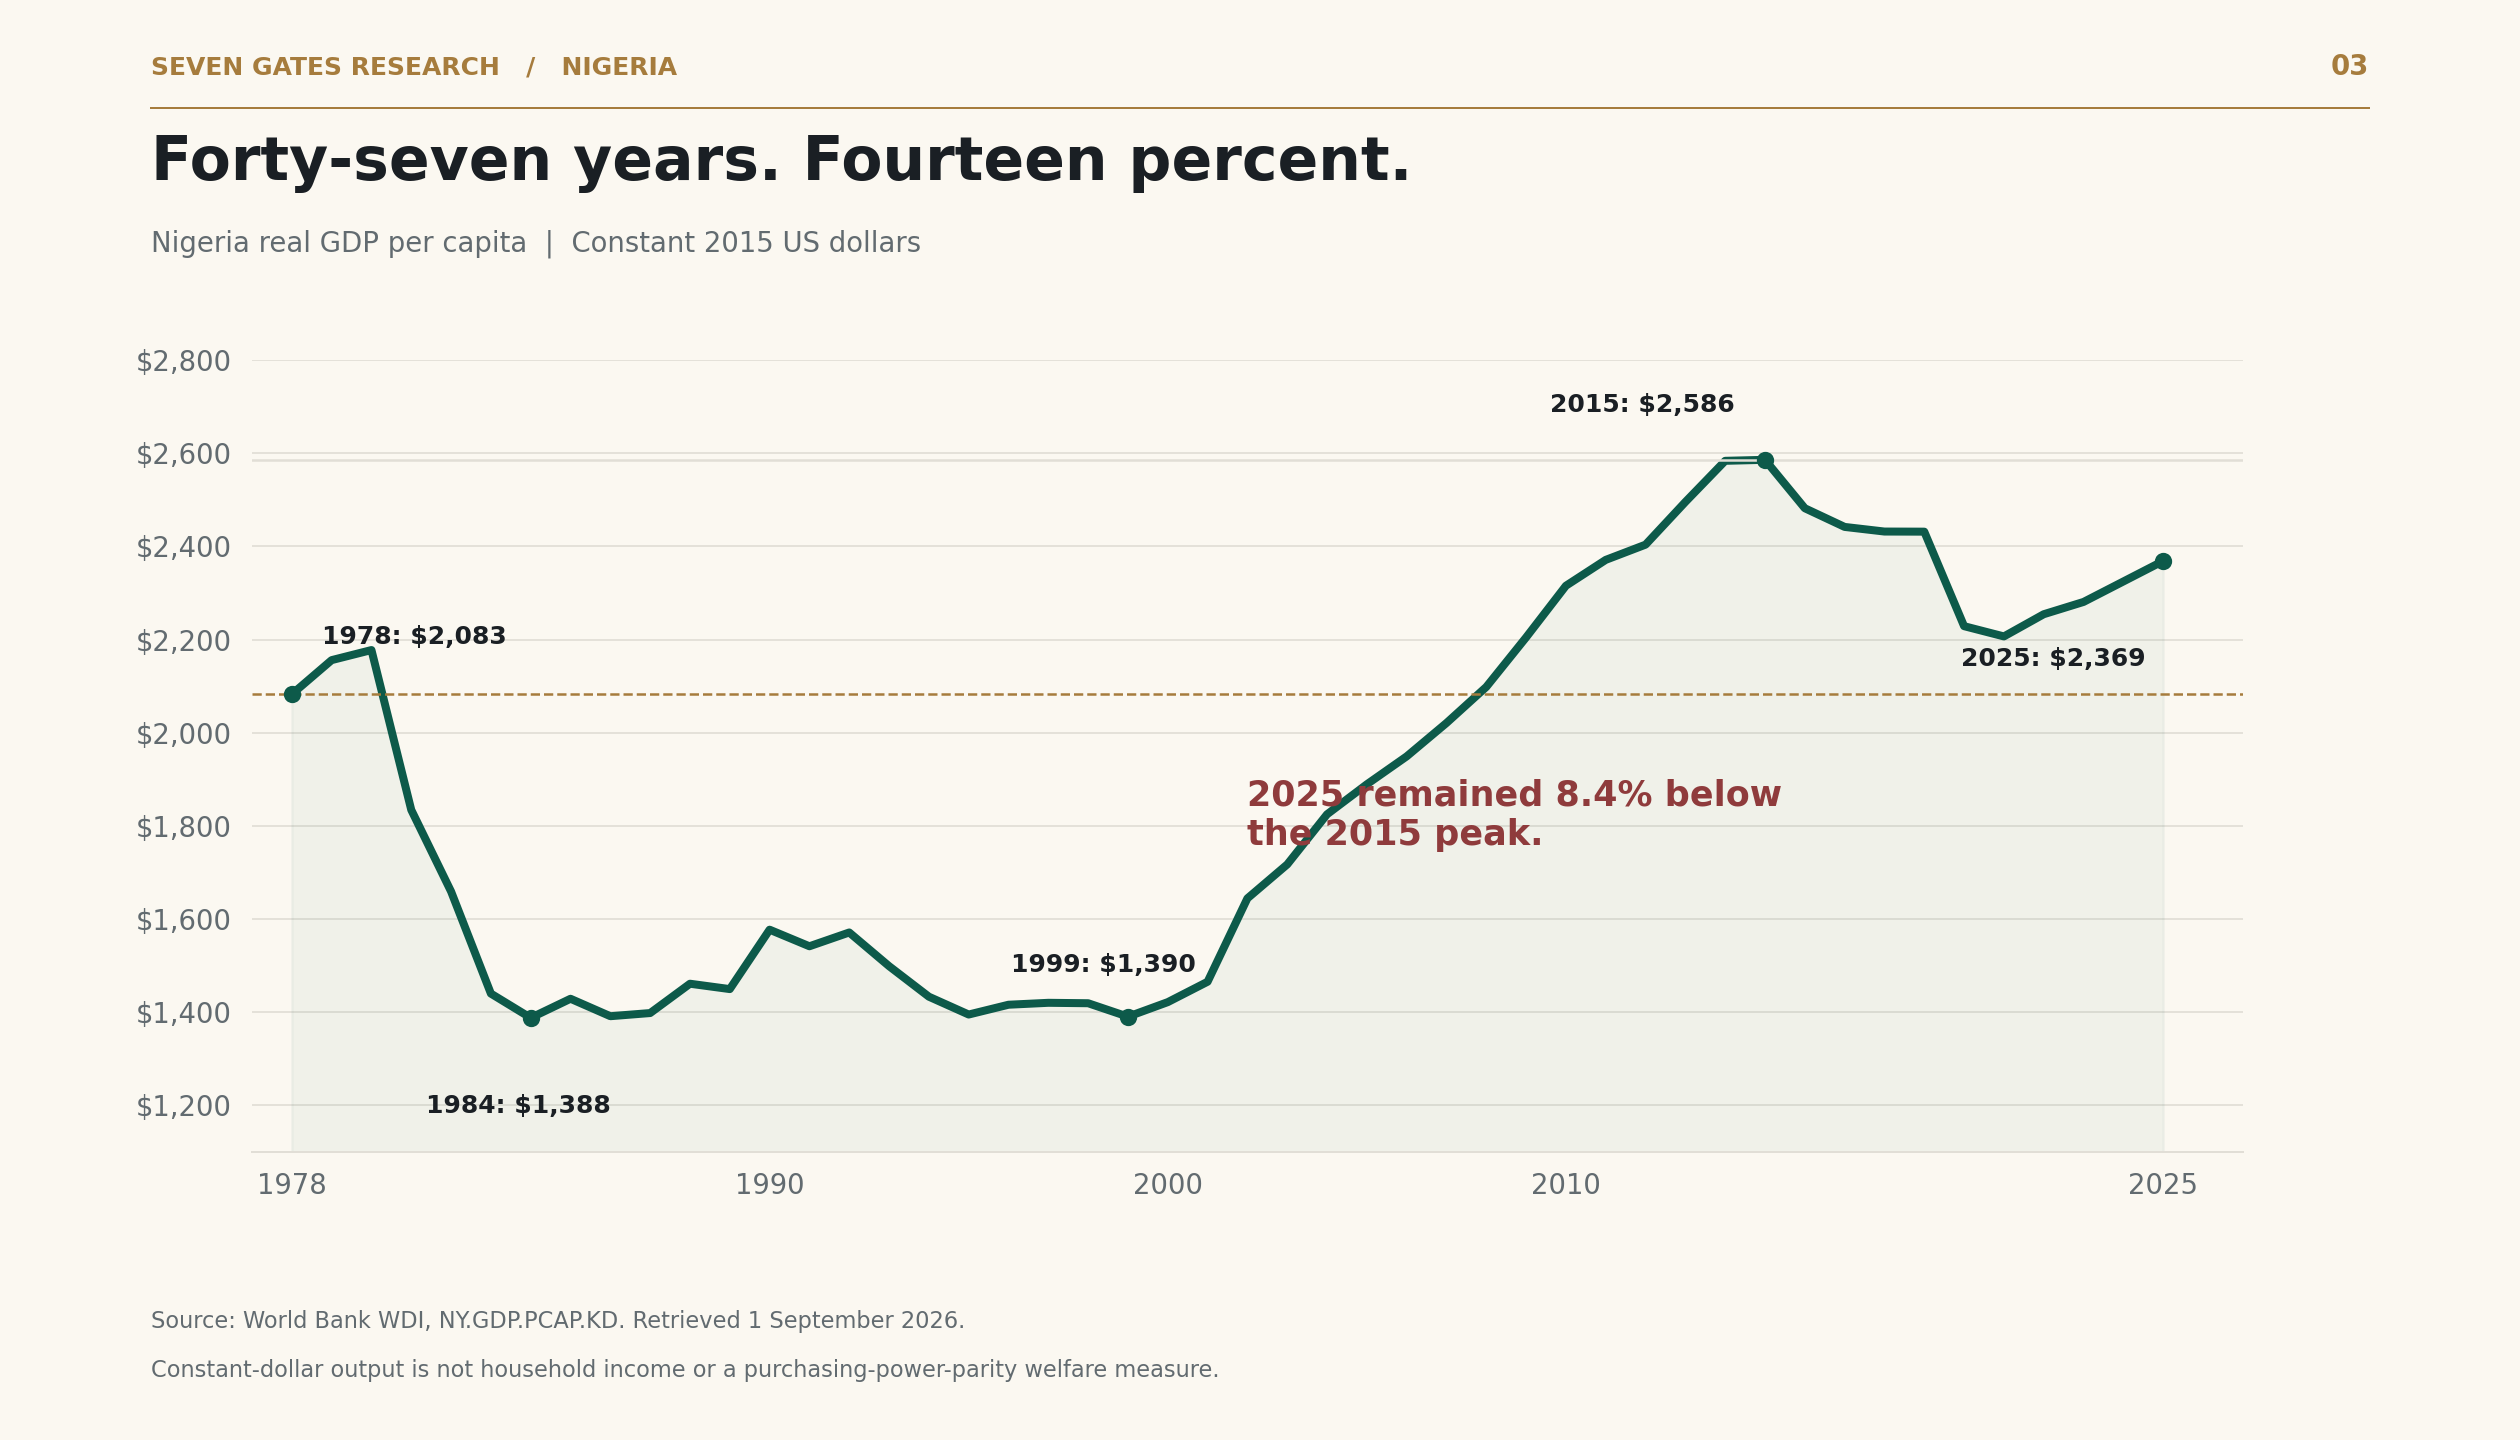
The signature chart: an early-2000s recovery followed by a decade in which output per person lost ground. Long national-account histories remain subject to revisions and changes in coverage.
When oil revenue became a theory of government
The late-1970s confidence was not wholly foolish. Infrastructure was needed. So were universities, ports and industrial capacity. Some investments were necessary, some were ambitious, and some belonged to the category in which enthusiasm reaches the procurement department several years before feasibility.
The deeper problem was treating a volatile revenue stream as a permanent increase in spending capacity. Oil strengthened the state’s purchasing power, encouraged imports and drew resources towards government, construction and urban activity. The country had acquired a valuable source of income. It had not acquired immunity from commodity prices.
When the oil economy weakened in the early 1980s, foreign exchange became scarce, imports were compressed and production suffered. On the real GDP-per-capita series, output per person fell from about $2,177 in 1980 to $1,388 in 1984, a decline of roughly 36%. That was a collapse households could recognise without asking where Nigeria stood in Africa. World Bank: real GDP per capita.
The response moved from controls and austerity towards the Structural Adjustment Programme of 1986. Currency adjustment and market reforms brought changes, but not a durable escape from oil dependence, fiscal instability and policy reversals. By 1999, real output per person was still about $1,390. Two decades had produced an extraordinary volume of national history and very little additional output per citizen.
There is an instructive diversion in the dollar figures. The World Bank series records nominal GDP falling from roughly $218 billion in 1998 to $59 billion in 1999. Real production did not fall by anything remotely resembling 73%. The series carries the effects of exchange-rate conversion and statistical conventions, which require care around breaks. Civilian government did not arrive and physically misplace three-quarters of the economy. World Bank GDP series via FRED.
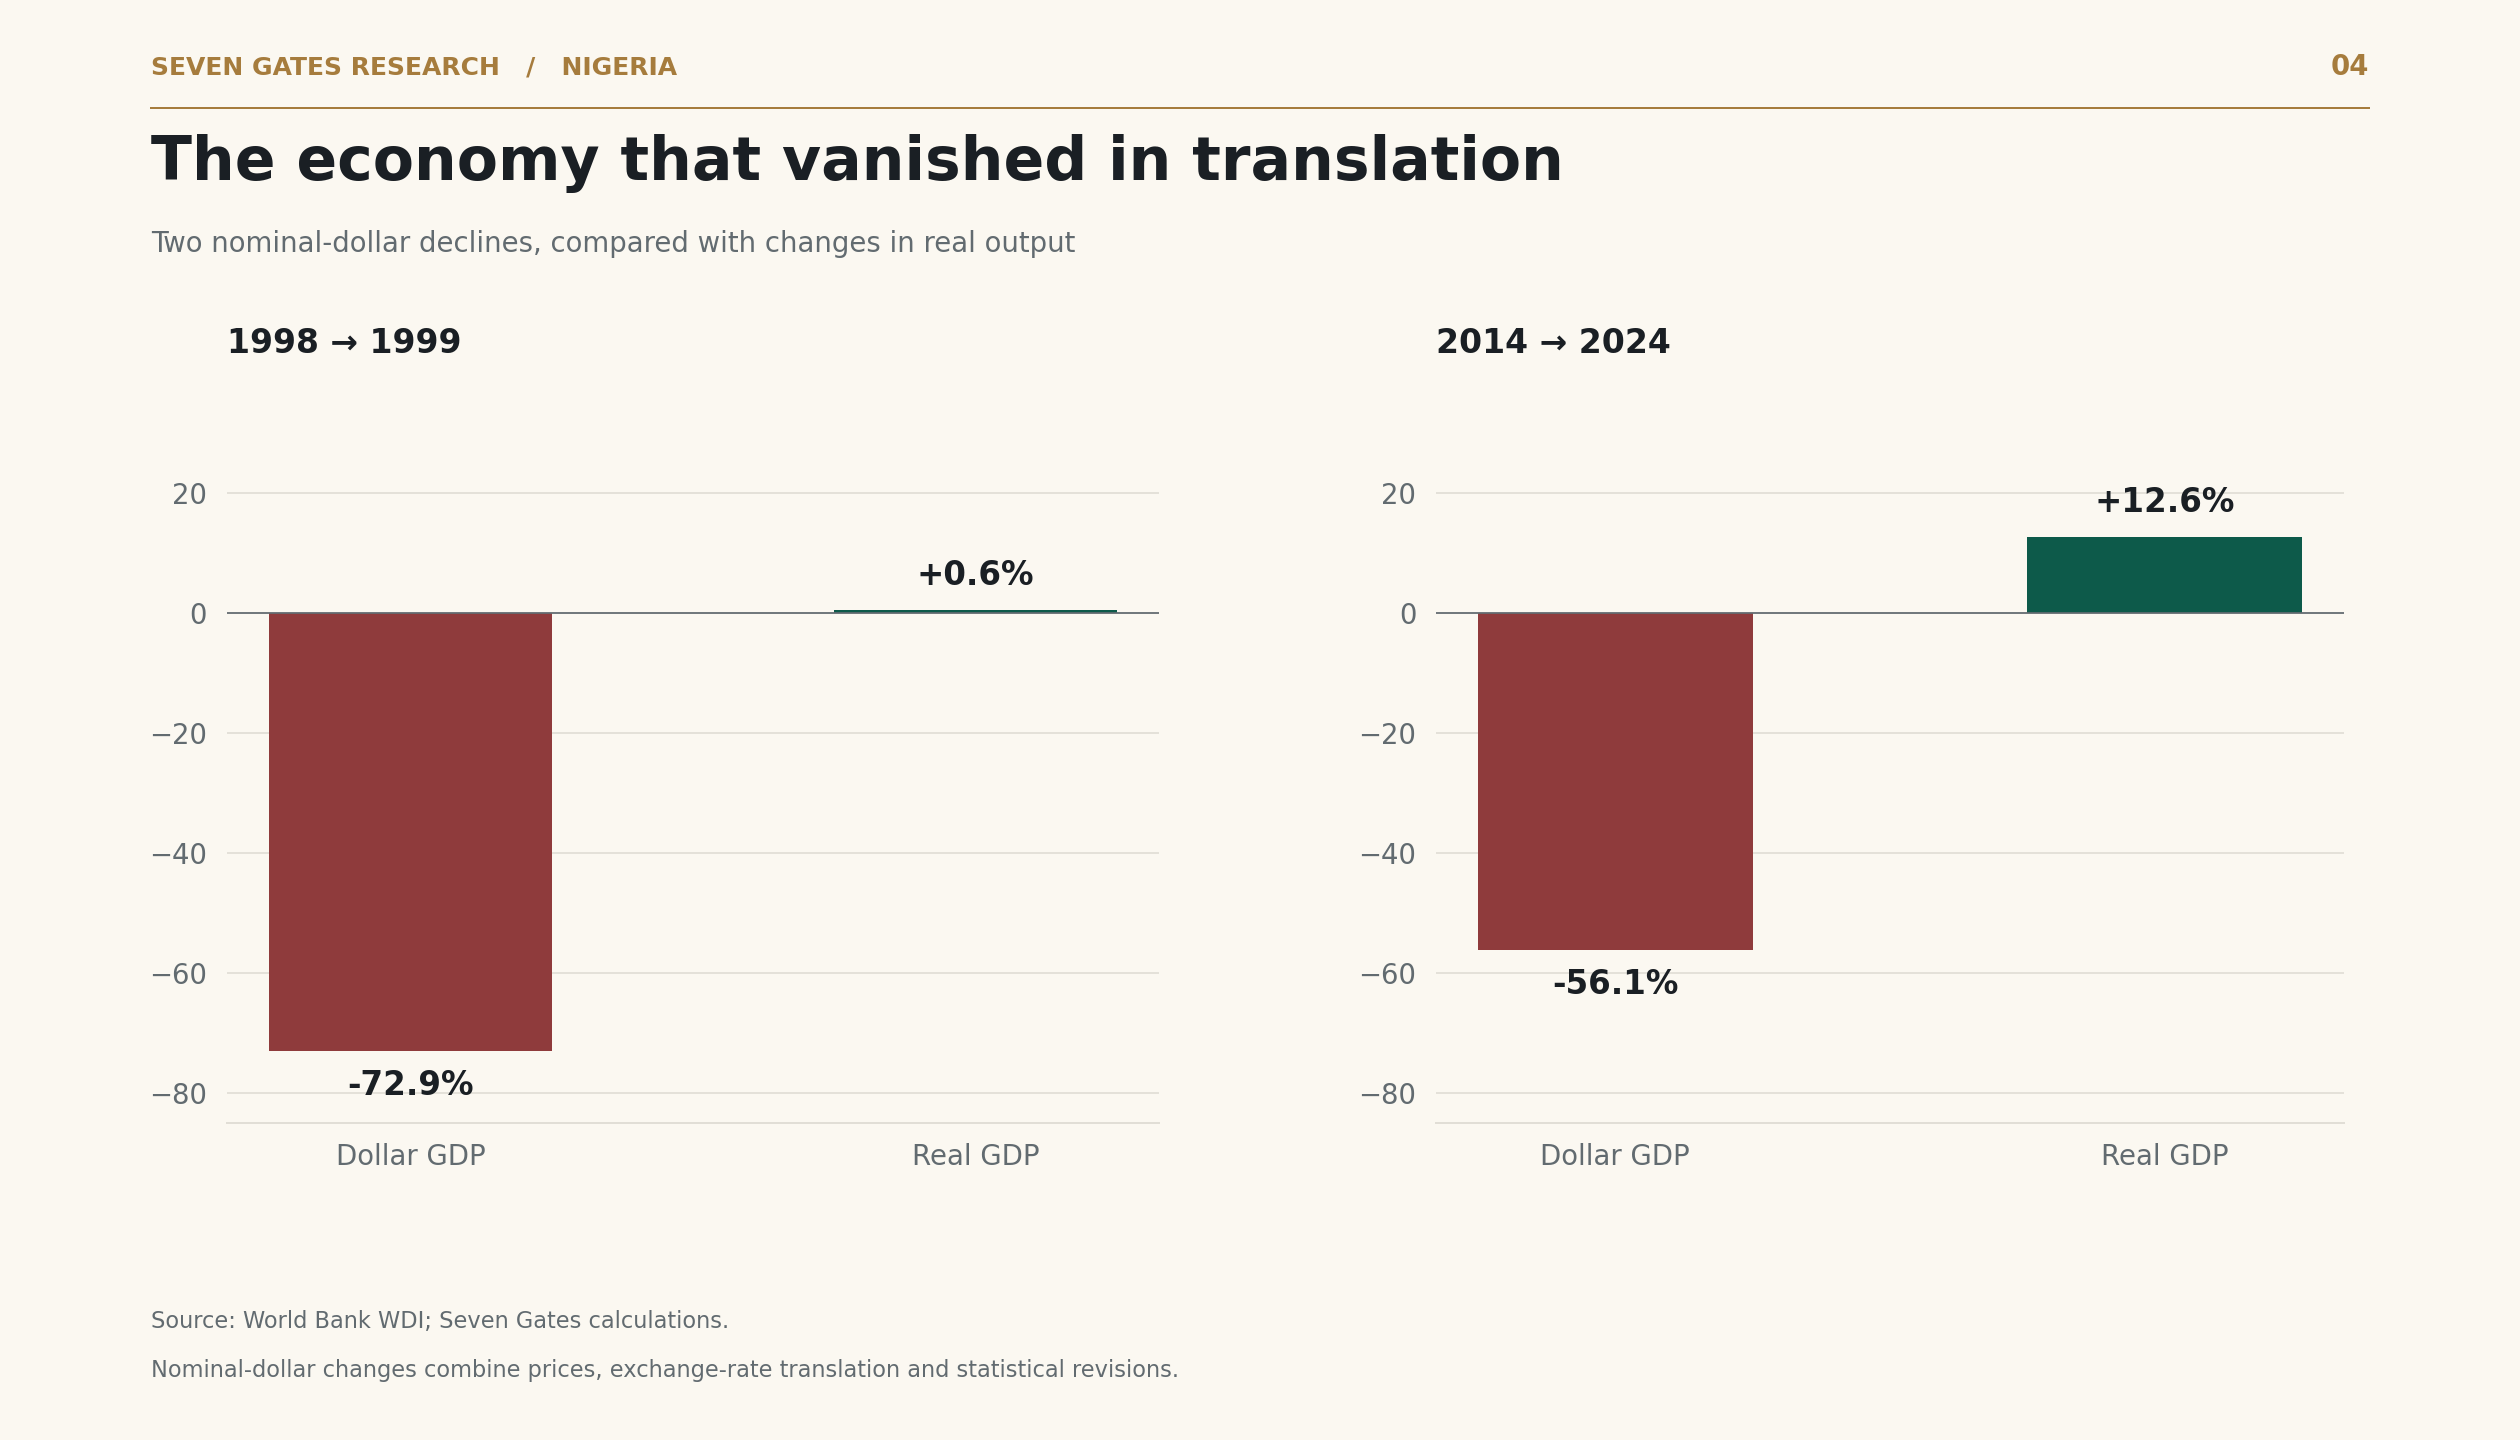
A numerically correct dollar chart can still invite the wrong conclusion about physical production.
A short visit to the farm
Agriculture’s share of GDP usually falls as countries develop. That can be a sign of success: better-equipped farmers produce more while workers find more productive employment in processing, factories and services. A smaller agricultural share need not mean less food or poorer farmers.
Nigeria’s agricultural share was about 12.2% in 1981, compared with 23.0% in 2025 on the WDI series. Morocco’s was approximately 10.7% and 10.6% at those dates. Egypt’s share fell from about 21.6% to 16.6%, though its recent revisions make a smooth historical story especially unwise. Vietnam’s available comparison begins later: about 38.7% in 1990 and 11.6% in 2025. The benchmark years and the limitations belong beside the chart. World Bank: agriculture’s GDP share.
A share is a ratio. It can rise because agriculture does better, because other sectors do worse, because relative prices change, or because measurement changes. It is not a productivity verdict, nor does it tell us how many people have entered farming.
Nor does every productivity comparison flatter the preferred international example. The World Bank’s 2025 agricultural value added per worker estimate is about $3,495 for Nigeria and $3,418 for Vietnam, in constant 2015 dollars. Nigeria is slightly ahead on that measure. Differences in crops, prices and employment estimates complicate comparison, and these are not PPP-adjusted earnings. Vietnam’s larger development achievement lies in the wider transformation of its economy, not victory in every agricultural statistic. World Bank: agricultural value added per worker.
Imagine a farmer in Benue deciding how much to plant. The soil may be willing. The calculation still includes fertiliser, transport and whether the family can safely reach the field and return. A tractor improves the arithmetic only after that last question has an acceptable answer. FAO’s April 2025 assessment found that conflict had severely restricted access to fields and contributed to below-average planted area in 2024. Its February 2026 assessment still identified conflict and displacement as forces eroding rural livelihoods. Agriculture could plausibly have produced more under safer conditions; these reports do not establish how many extra percentage points it would have added to Q2 growth. FAO: production and field access; FAO: February 2026 assessment.
Then imagine the farmer’s graduate son returning home because the salary on offer in town barely covers rent and transport. Another pair of hands arrives; the family’s acreage and equipment stay the same. Where people enter farming because other work pays too little, or to cushion expensive food, the farm becomes a household safety net. Some entrants see a commercial opportunity. Others need supper. Neither movement can be read off agriculture’s GDP share, and a growing workforce can increase the number of farmers even while their share of employment falls. The World Bank’s jobs diagnosis is pertinent: being employed is insufficient when productive, better-paying work remains scarce. World Bank: October 2024 development update.
Can fewer people farm and produce more? Yes, if output per worker rises enough. Irrigation, better seed, mechanisation services, secure tenure, storage and dependable buyers can make that possible. Higher yields and lower losses must also cover the cost of equipment and finance if farmers are to earn more. A tractor is allowed to have a business plan.
The son might then earn more maintaining machinery, processing food to export standards or working in a competitive factory. With training, reliable power and customers, others could sell engineering, software or business services abroad. Higher-value exports require capability and market access; moving people out of farming does not conjure either. Build those opportunities alongside better farms, and a smaller farming workforce can feed more people while the wider economy earns more. Simply displacing workers into another precarious trade would leave the family with much the same problem and a different commute.
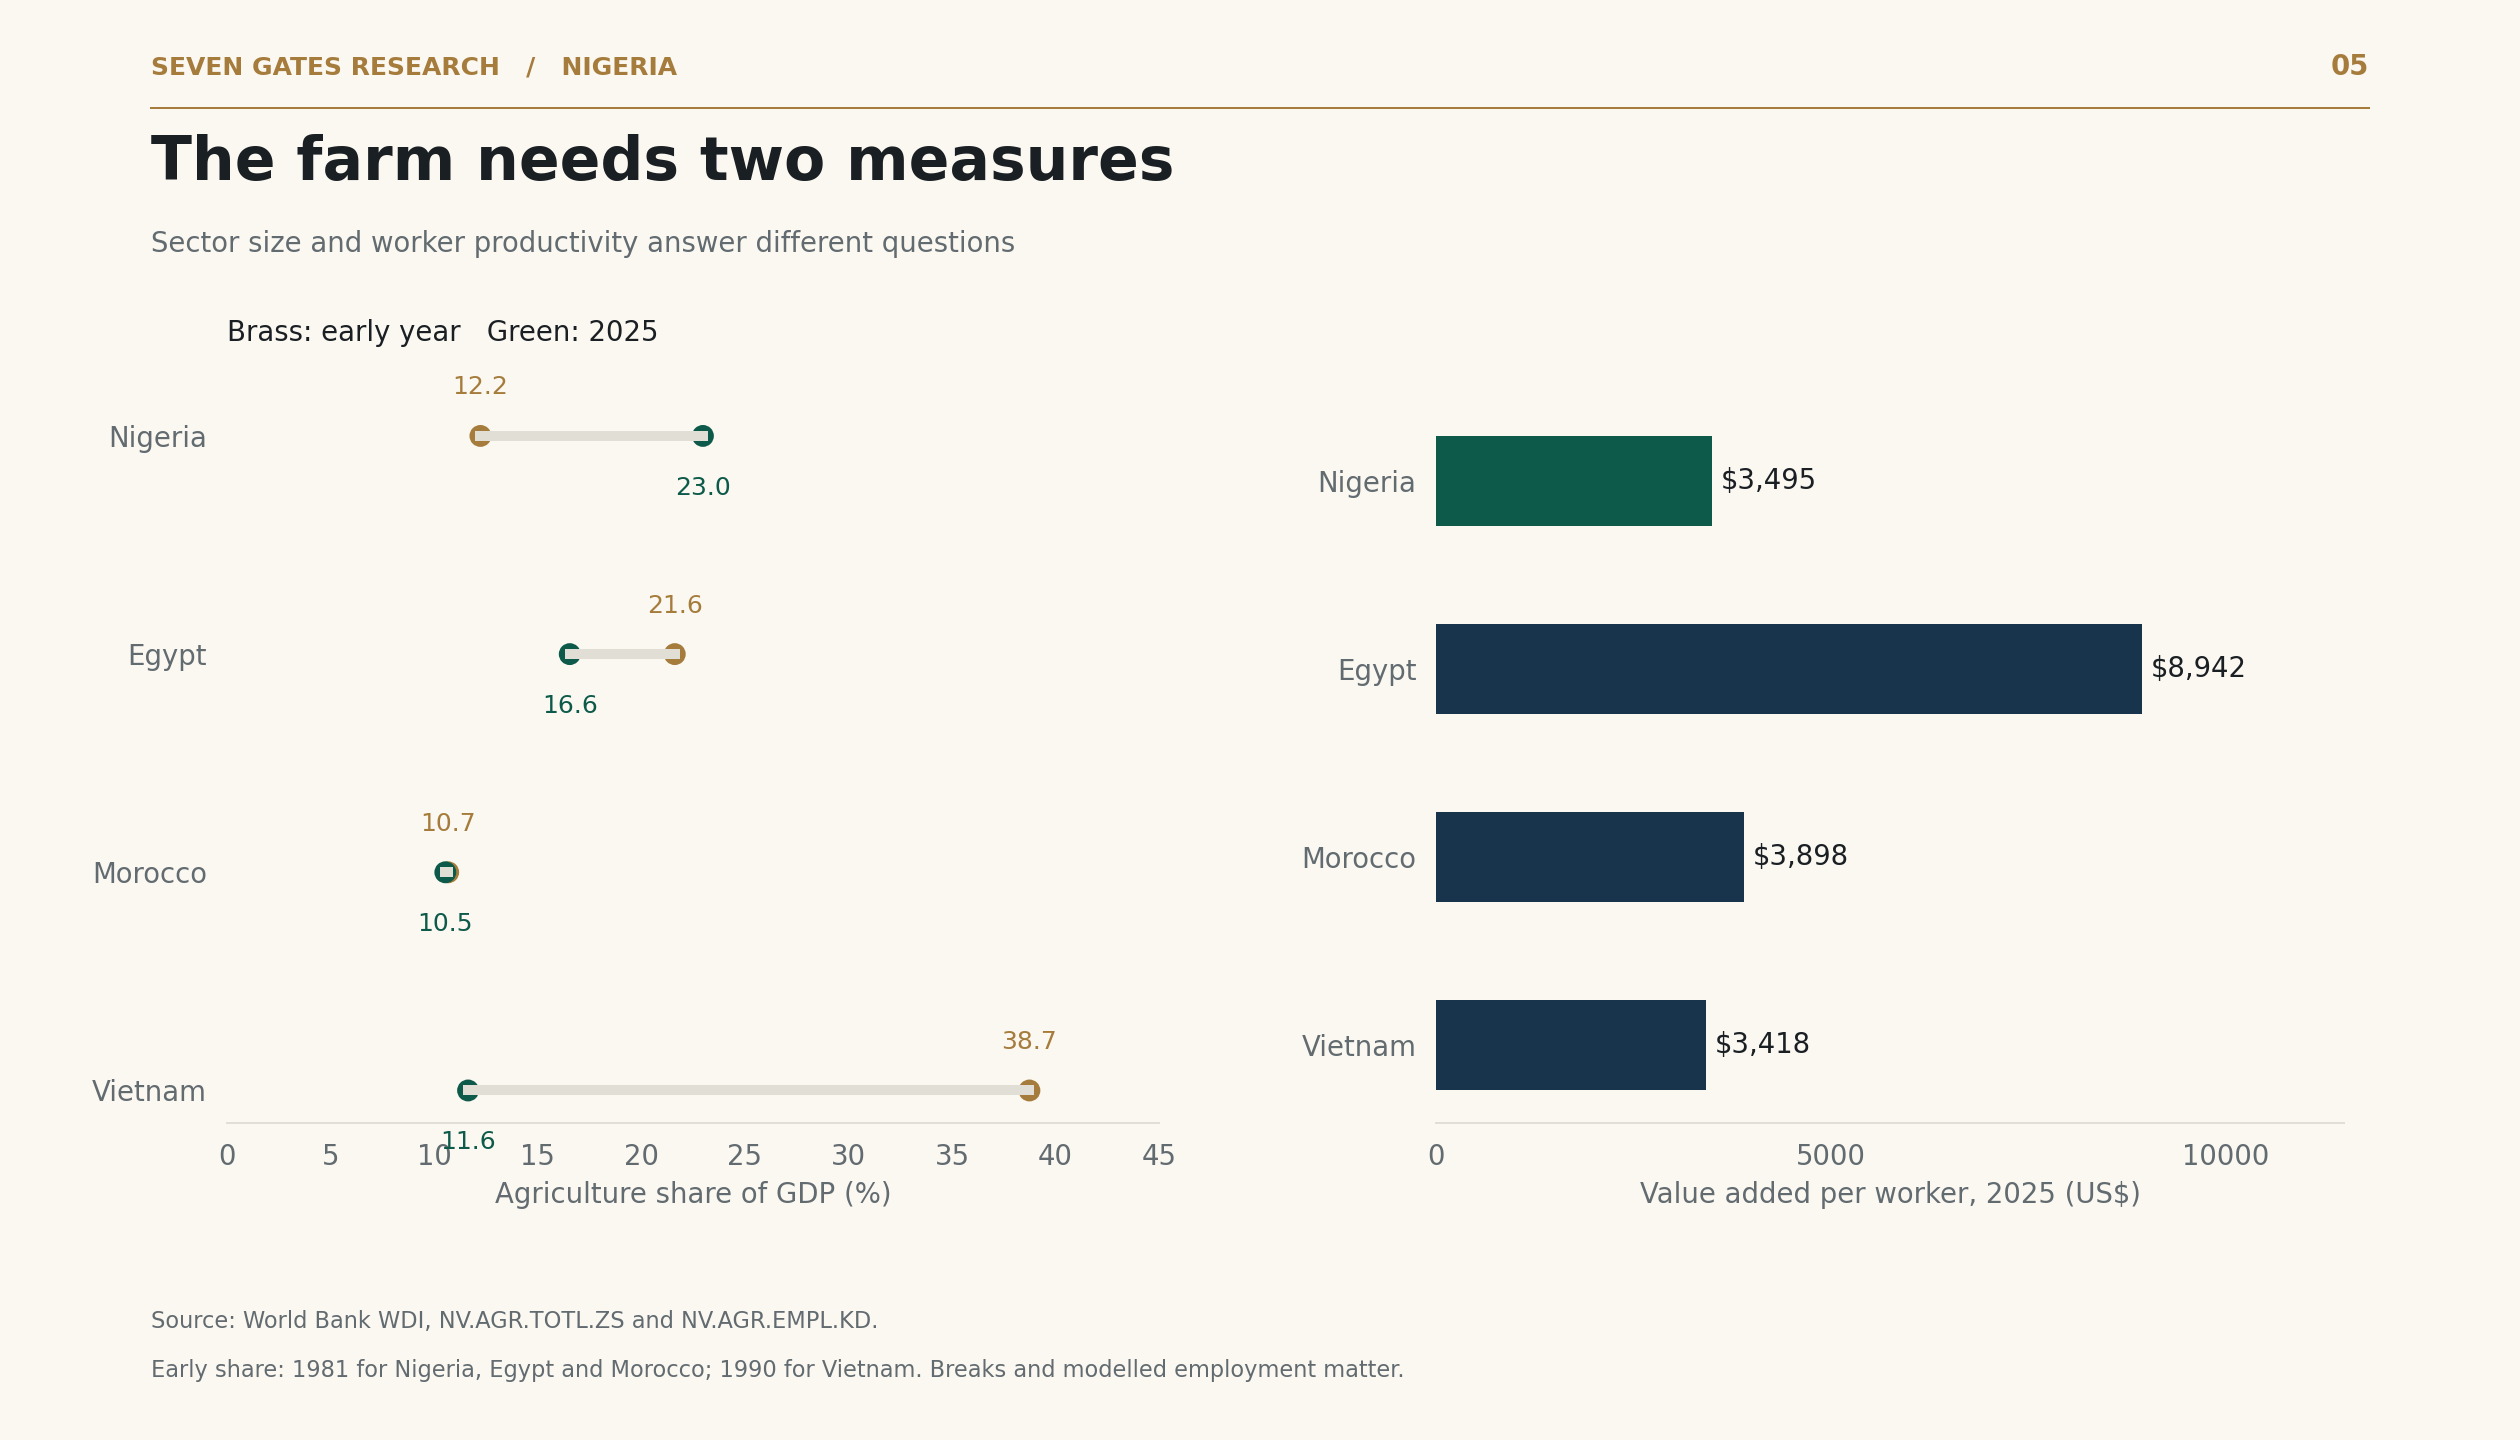
Different starting years are disclosed. Agriculture includes forestry and fishing; labour-productivity estimates depend on employment measurement.
The recovery Nigeria should remember
Between 2000 and 2014, real output per person rose by approximately 82%. The oil market helped, as did the global environment. But the domestic changes were substantial: telecommunications opened up, banking changed, debt relief eased the sovereign burden, private investment expanded and services became deeper.
Telecommunications offers a particularly recognisable example. Obtaining a line had once required patience, influence and a working relationship with disappointment. Commercial mobile networks made communication available on a radically different scale. A market trader could call a supplier without first making an application to the state’s idea of modernity.
The point is not that mobile phones explain the whole recovery. They do not. The point is that Nigeria has already experienced what happens when useful changes last long enough for firms and households to adapt, invest and learn. World Bank: mobile subscriptions, real GDP per capita.
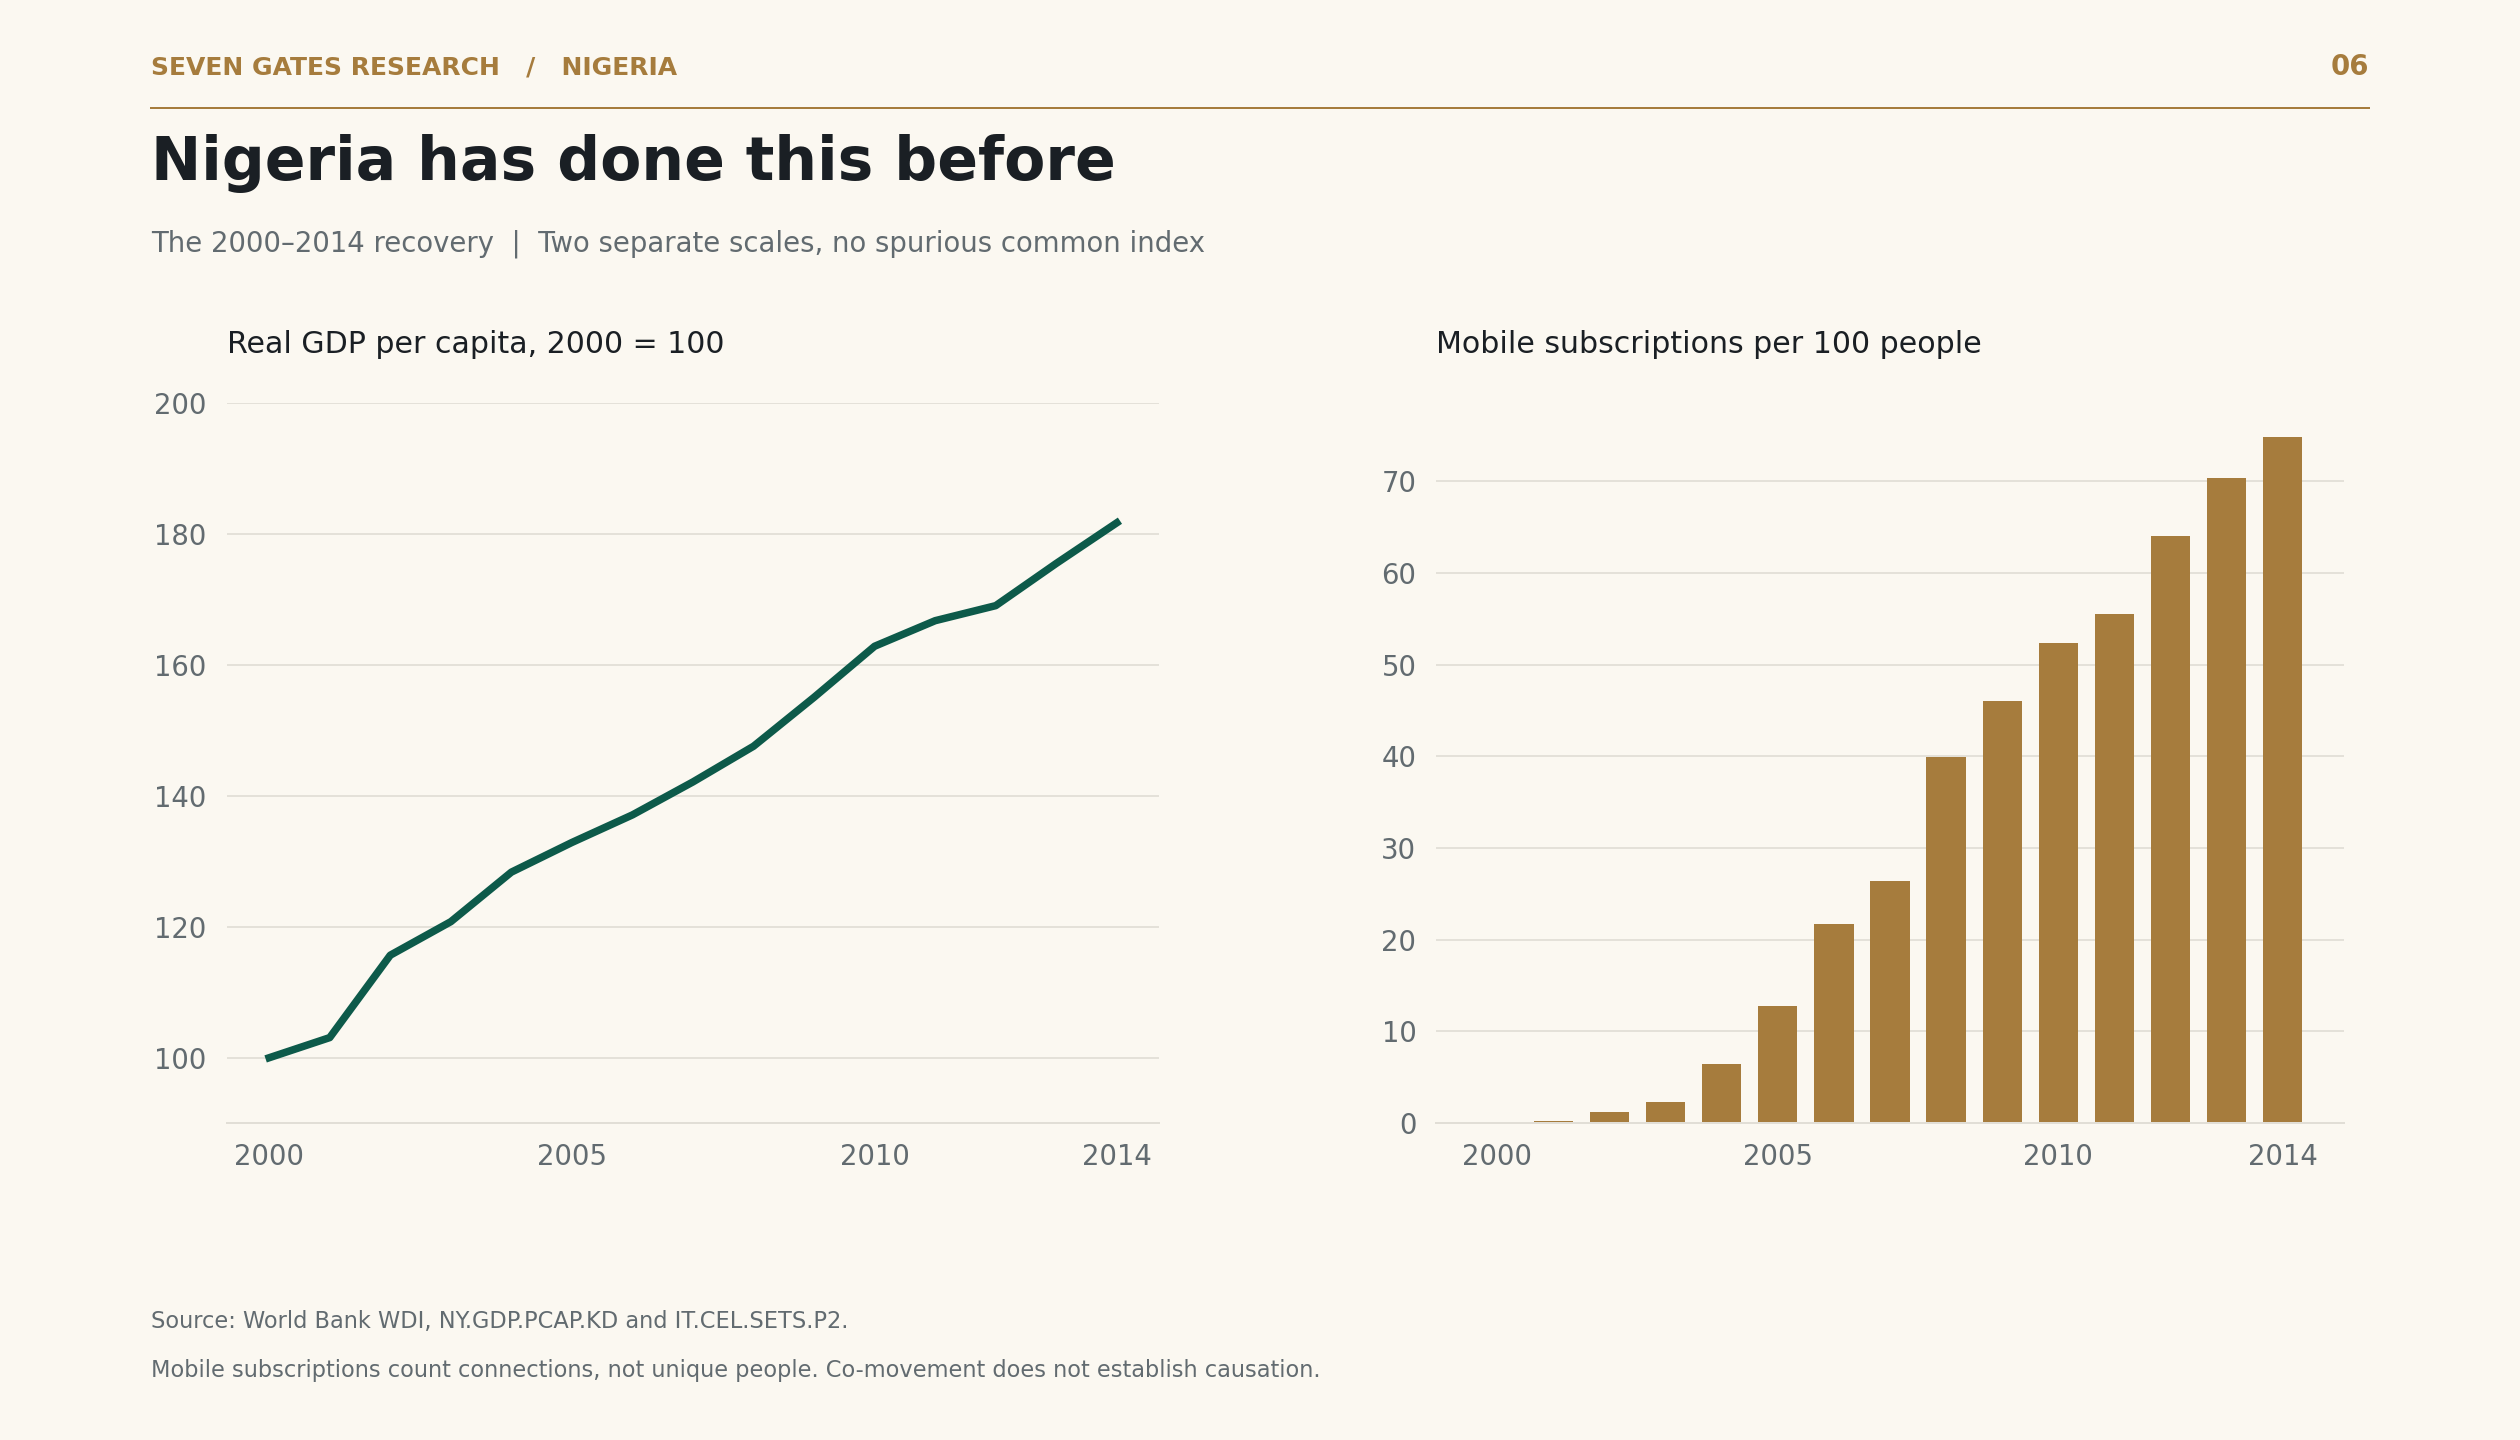
Separate scales avoid the distortion of indexing mobile subscriptions from a near-zero base. The comparison illustrates concurrent changes, not a causal estimate.
What if Buhari had not won?
Counterfactual history is a comfortable business: the alternative president never publishes audited accounts. Nevertheless, the question can be useful if the claims remain modest.
The oil-price shock began before Muhammadu Buhari took office in May 2015. Another government would still have faced falling export receipts, pressure on reserves, insecurity and a difficult currency adjustment. Extending the earlier boom indefinitely is not a credible alternative history.
Policy choices still mattered. The IMF’s contemporary assessment identified policy uncertainty as an amplifier of Nigeria’s external shock; its subsequent review described recession, foreign-exchange restrictions and the need for adjustment. That is a firmer basis for criticism than assigning every lost naira of output to one election. IMF 2016 consultation, IMF 2017 consultation.
Earlier exchange-rate adjustment, fewer distortions in access to foreign currency and a clearer policy framework might plausibly have reduced the damage to investment and manufacturers needing imported inputs. They could also have brought inflation and balance-sheet pain forward. There is no painless version of losing a large share of export income.
Our inference is that policy could have changed the depth and duration of the damage. This essay does not estimate the size of that effect. “A different president would have made Nigeria Vietnam” belongs on another shelf.
Growth with an expensive handbrake
In July 2026, headline inflation was 15.43% and food inflation 20.31%, both measured year on year. Lower headline inflation is welcome, but disinflation means prices are rising more slowly; it does not mean the earlier increases have been reversed. NBS CPI release reported by Reuters / CNBC Africa.
Subtracting inflation from the 4.43% real GDP growth figure would count price adjustment twice. Real GDP already removes the effect of economy-wide price changes using national-account deflators, which differ from the household consumer basket.
The household problem is less tidy. A salary can rise by 10% while food costs rise by 20%. A manufacturer can produce more physical goods yet need much more working capital. A business can announce record naira revenue while selling fewer units. Borrowing to expand may become expensive just when demand is least dependable.
Inflation does not mathematically cancel real growth. It can make that growth harder to finance and much less visible in daily life. The freezer has no column for seasonally adjusted optimism.
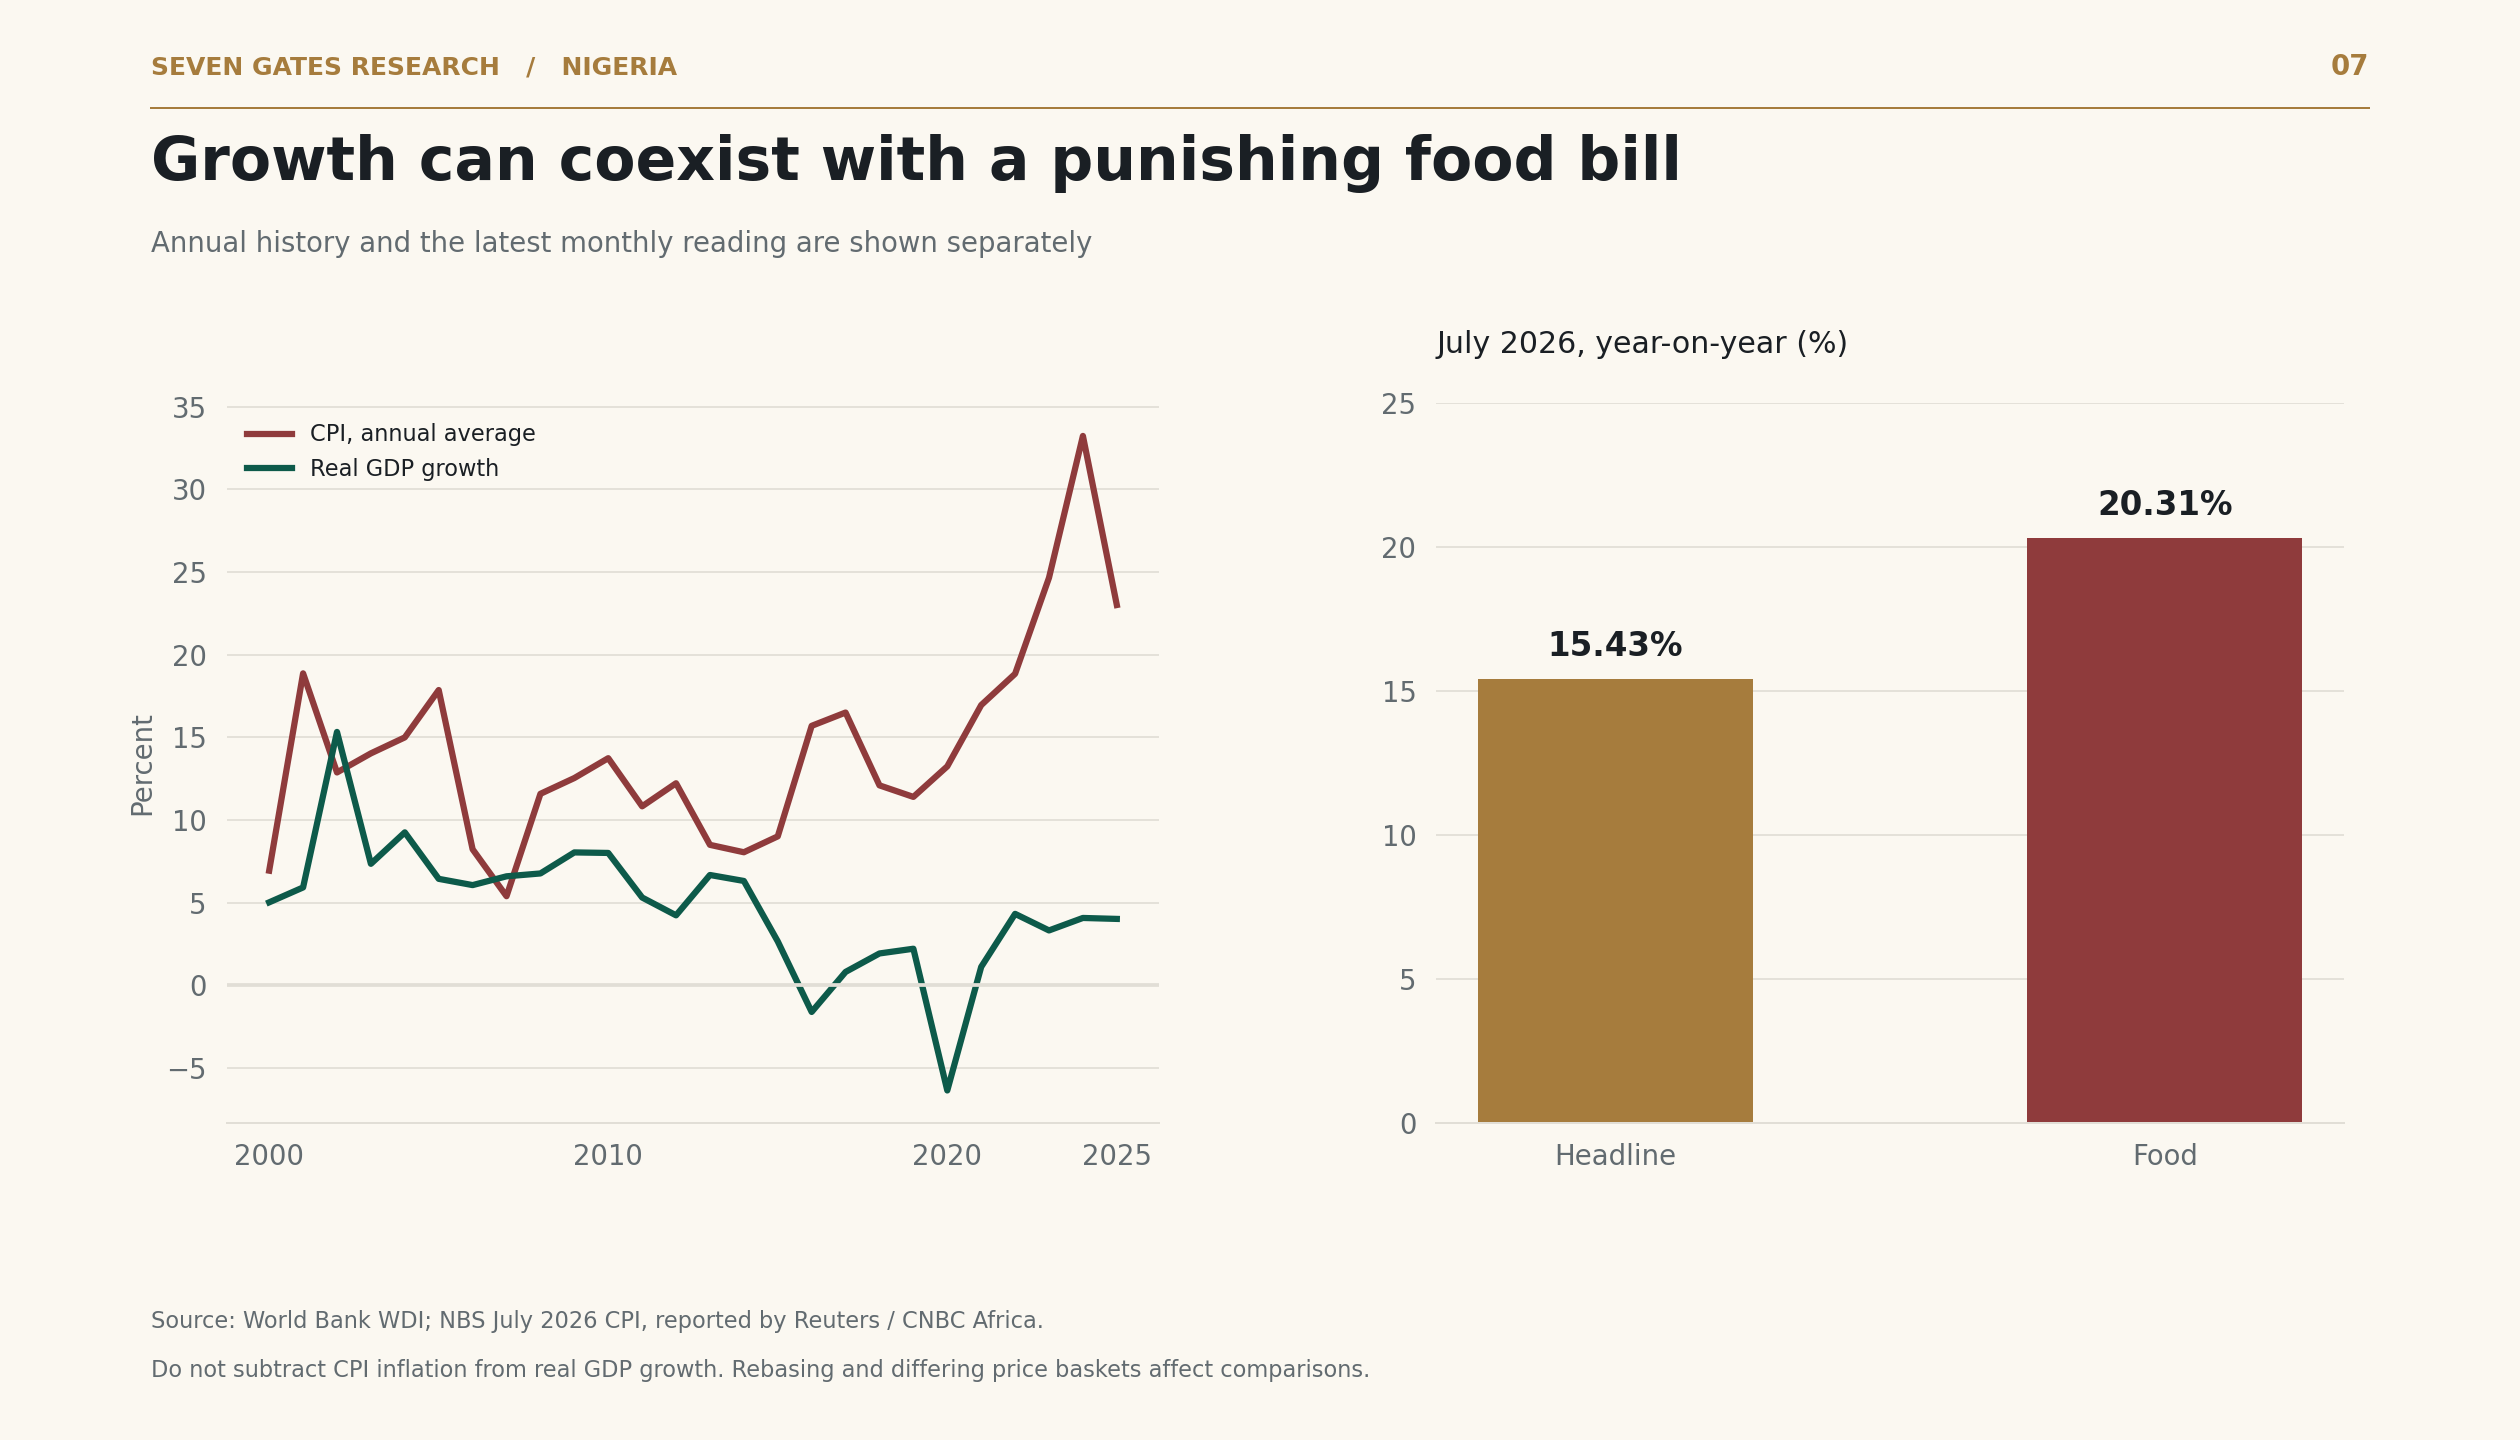
Annual averages and monthly year-on-year readings are not interchangeable. The historical CPI and GDP series also contain revisions.
Nigeria’s unemployment number needs company
The NBS Labour Force Survey reported 4.3% unemployment in Q2 2024. Taken alone, that sounds like the sort of result for which a government might commission a commemorative flyover.
The same survey reported 9.2% time-related underemployment, 85.6% self-employment and 93% informal employment. These are a dated snapshot, not a claim about labour-market conditions in September 2026. Unemployment is measured against the labour force; the other indicators concern employed people, overlap and cannot be added. NBS Labour Force Survey Q2 2024.
The methodology recognises qualifying work for pay or profit, including as little as one hour during the reference week. It does not certify that the work pays enough, uses the person’s skills or offers secure hours. Nor does it make unemployment a percentage of the entire population.
Where household savings and unemployment insurance are limited, people have to find something to do. They trade, farm, repair, deliver, drive and run several small businesses, one of which may have a better logo than cash flow. That activity is economically real. The income can still be inadequate.
Informality and self-employment are not synonyms for failure; both contain productive enterprises. The question is whether workers can obtain more capital, skills, reliable services and customers, so that their effort produces more value. “Create jobs” is an incomplete instruction when so many people already work extraordinarily hard.
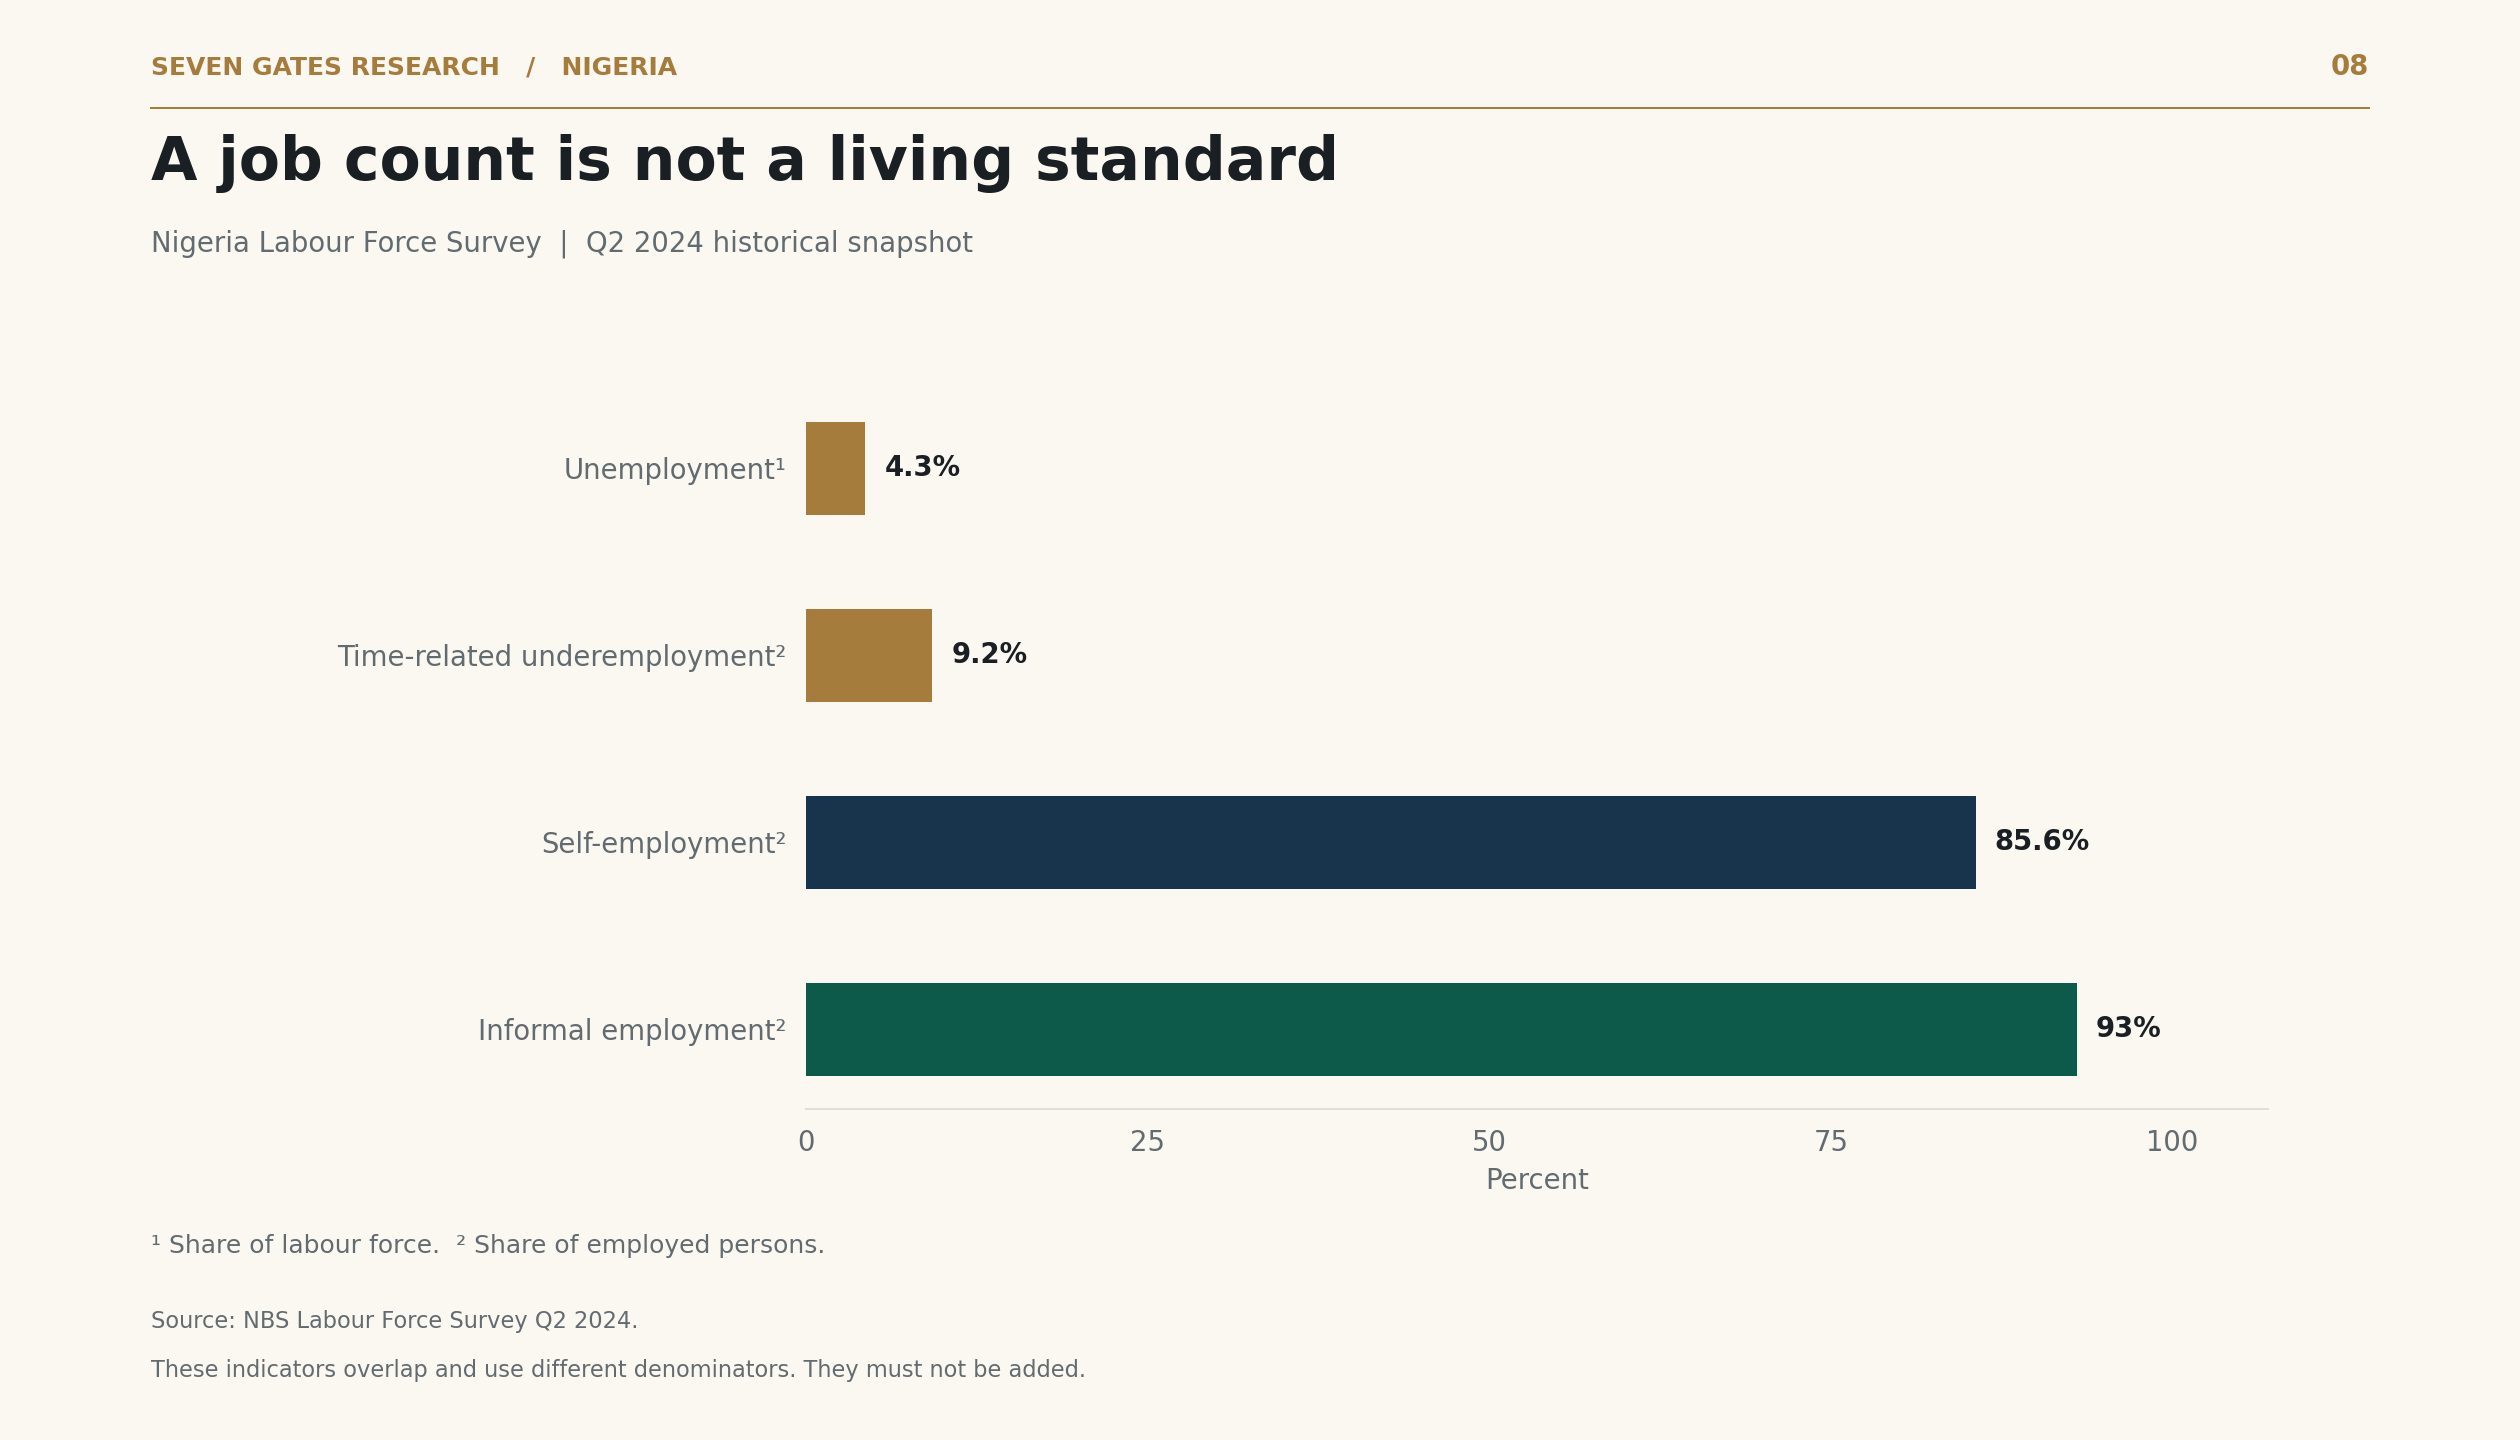
A low unemployment rate does not establish that almost everyone has a good job.
Banks and telecoms need a larger supporting cast
Finance and communications raise productivity well beyond their payrolls. Payments reduce friction, telecommunications improves coordination and properly allocated credit allows firms to invest before saving the full cost in cash. Their growth should not be dismissed because they employ fewer people directly than farming or construction.
But they cannot complete the assignment alone. Nigeria needs productive expansion in manufacturing, housing, logistics, commercial agriculture, processing, hospitality and export services. Much of that work happens in businesses that employ fifteen people, then forty, then two hundred, without ever attracting a ministerial commissioning ceremony.
The broad-sector Q2 2026 figures show 4.39% growth in agriculture, 3.96% in industry and 4.60% in services. These are sector growth rates, not their percentage-point contributions to the headline. Calculating contributions requires the appropriate real-output weights and consistent national-account definitions. NBS GDP release and tables, published sector breakdown.
An expansion led by activities that create productive work at scale can improve household incomes differently from one concentrated in a few capital-intensive sectors. Neither a sector label nor a headline percentage settles that question. Wages, employment, investment and output per worker must do some of the talking.
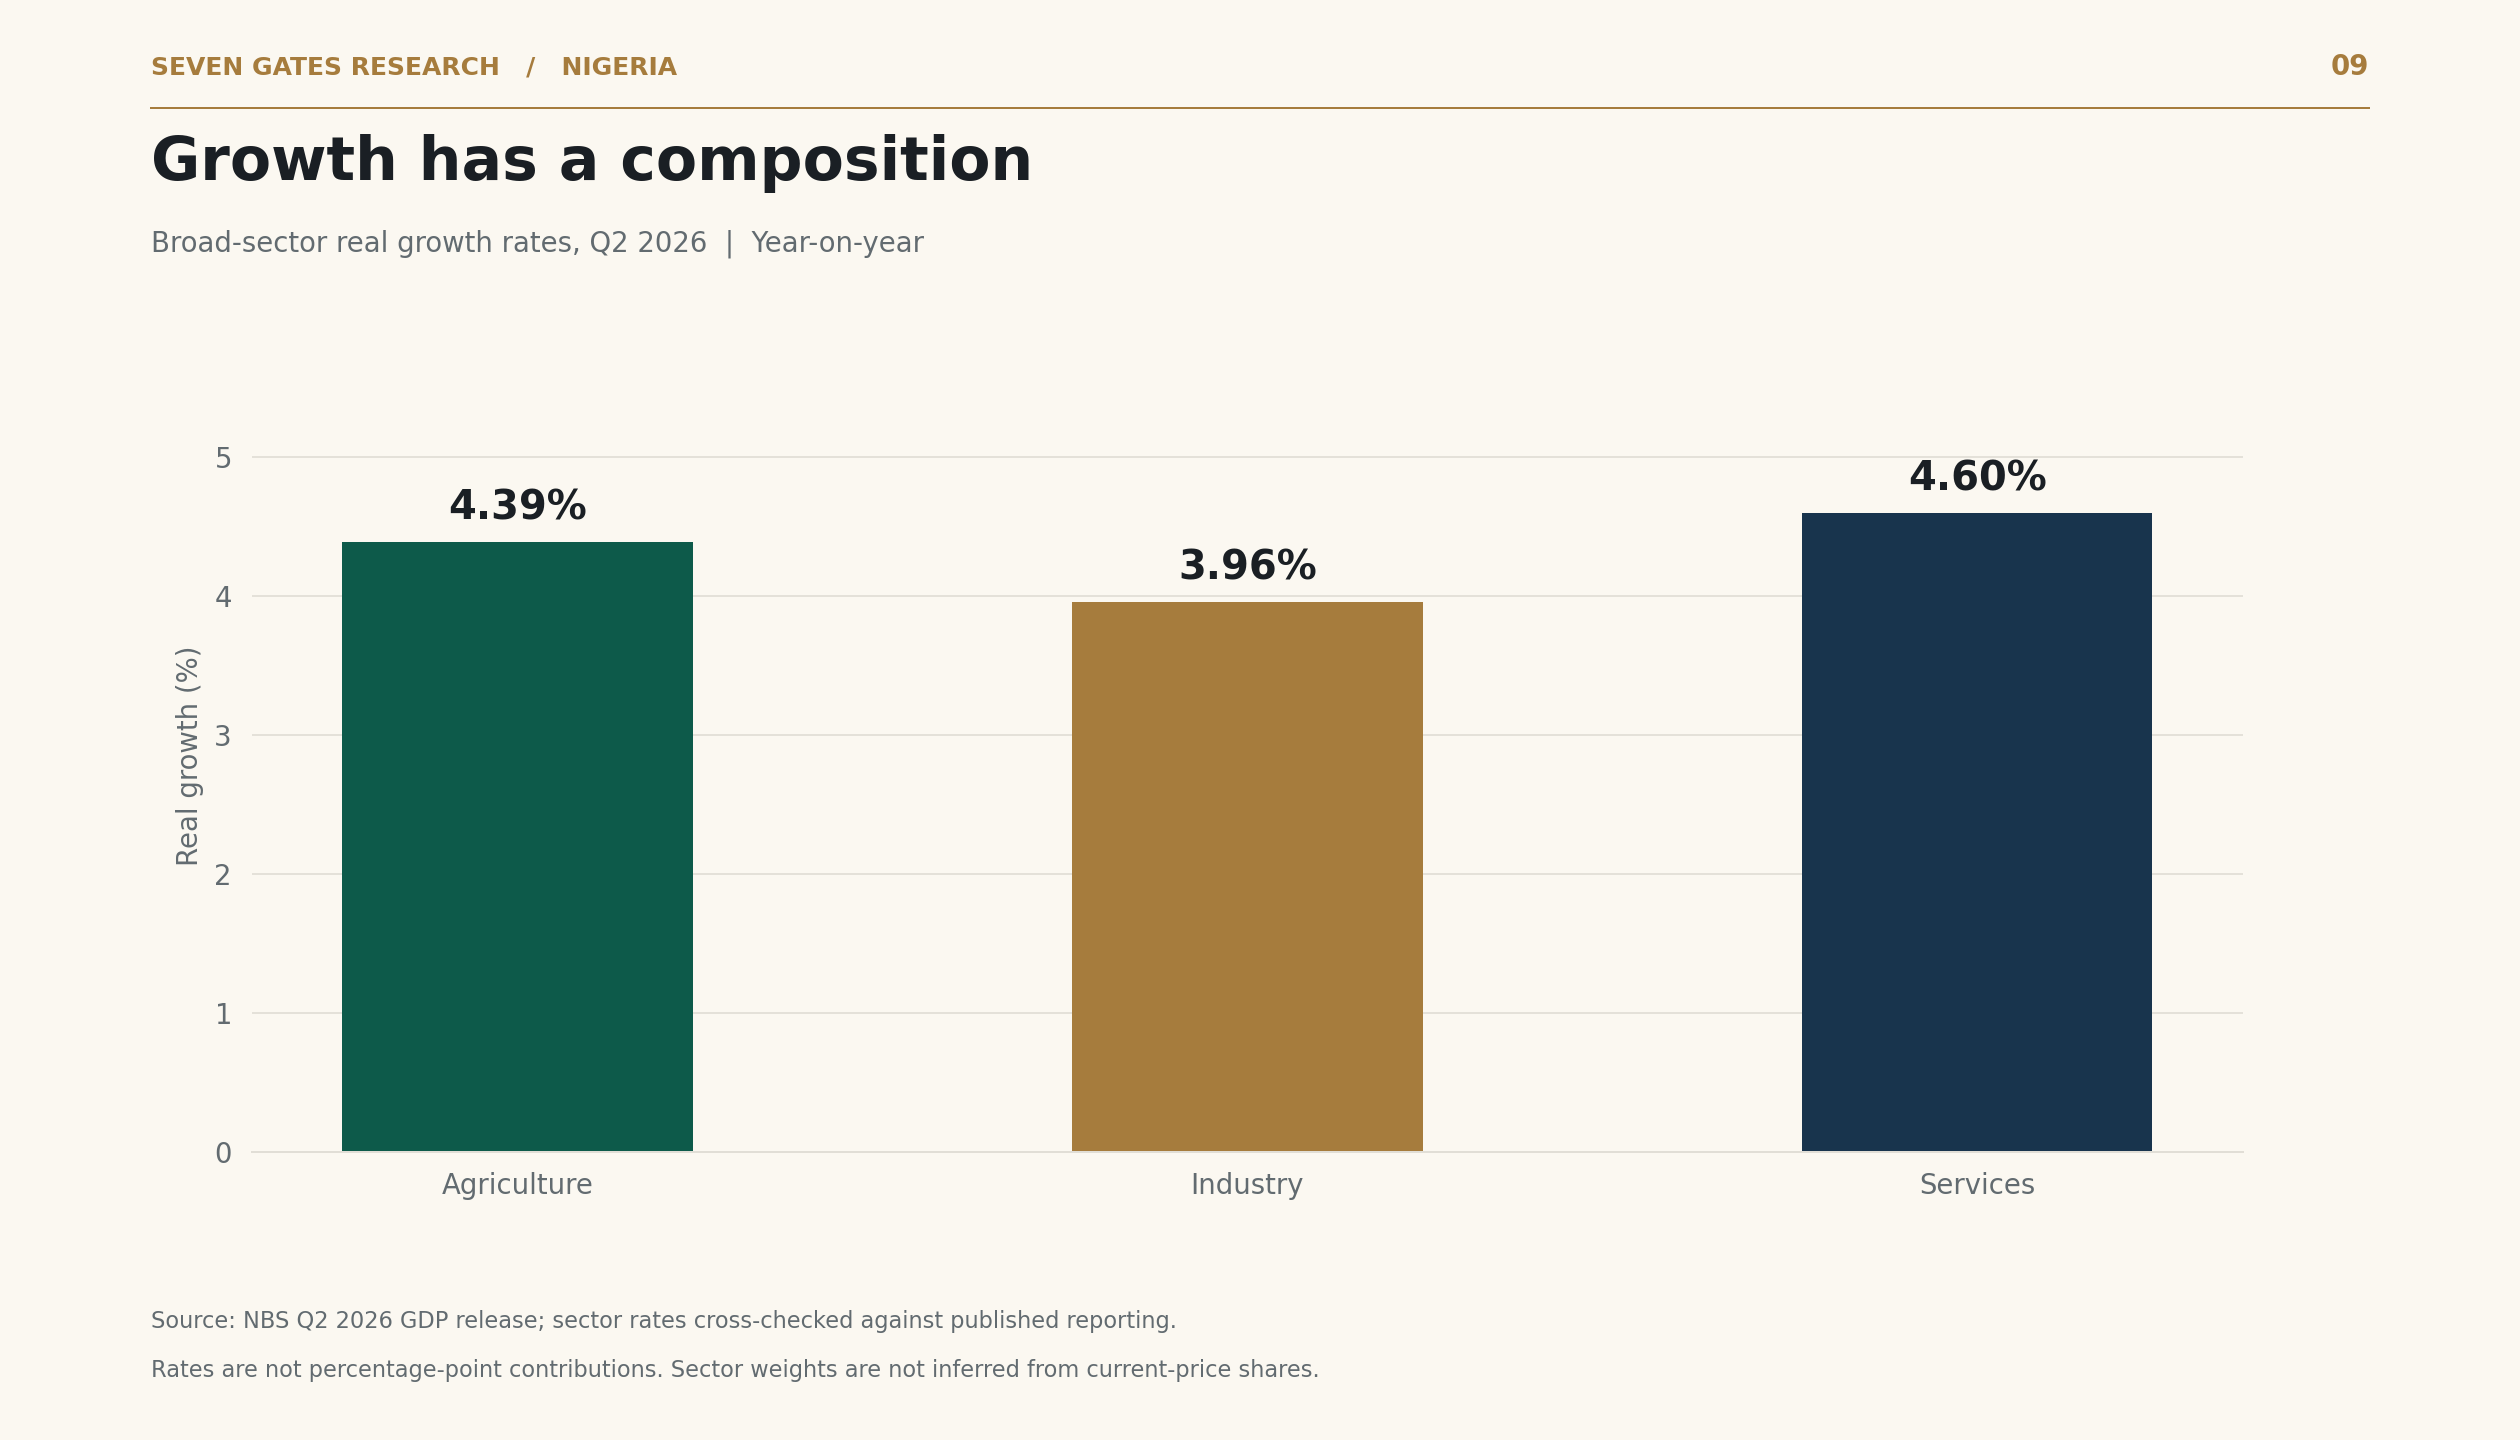
Growth has a composition. These rates should not be added together.
Vietnam: history cannot run the power station
Vietnam did not emerge from decades of war and immediately begin exporting electronics. The post-war economy struggled. The market-oriented changes associated with Đổi Mới, launched in 1986, developed over time, alongside investment, agricultural reform and greater integration with international trade. Health and infrastructure improved as the economy became richer. World Bank: Vietnam.
The comparison needs its qualifications. Vietnam had different institutions, geography, demographics and access to Asian supply chains. Nigeria cannot order the same starting conditions from a consultant. Nor should export totals be mistaken for domestic income: imported components can account for a substantial part of manufactured exports.
Even so, the contrast is difficult to miss. In the WDI data used here, Vietnam’s manufacturing share was about 24.5% in 2025, against Nigeria’s 8.3%. Goods exports per person were approximately $4,655 versus $234. Electricity access was 100% versus 62.5% in 2024, although connection does not guarantee reliable service. World Bank: manufacturing, merchandise exports, electricity.
History matters, including colonialism, war and international politics. It explains constraints. It becomes less useful when recruited to excuse indefinitely the parts of policy that can be changed. A country still has to connect the power, clear the goods and make the next investment worthwhile.
Vietnam’s transferable lesson is cumulative improvement. Firms learn, workers learn, suppliers improve and new capital arrives partly because earlier capital survived. Nigeria has frequently managed a promising opening. Development requires the subsequent chapters.
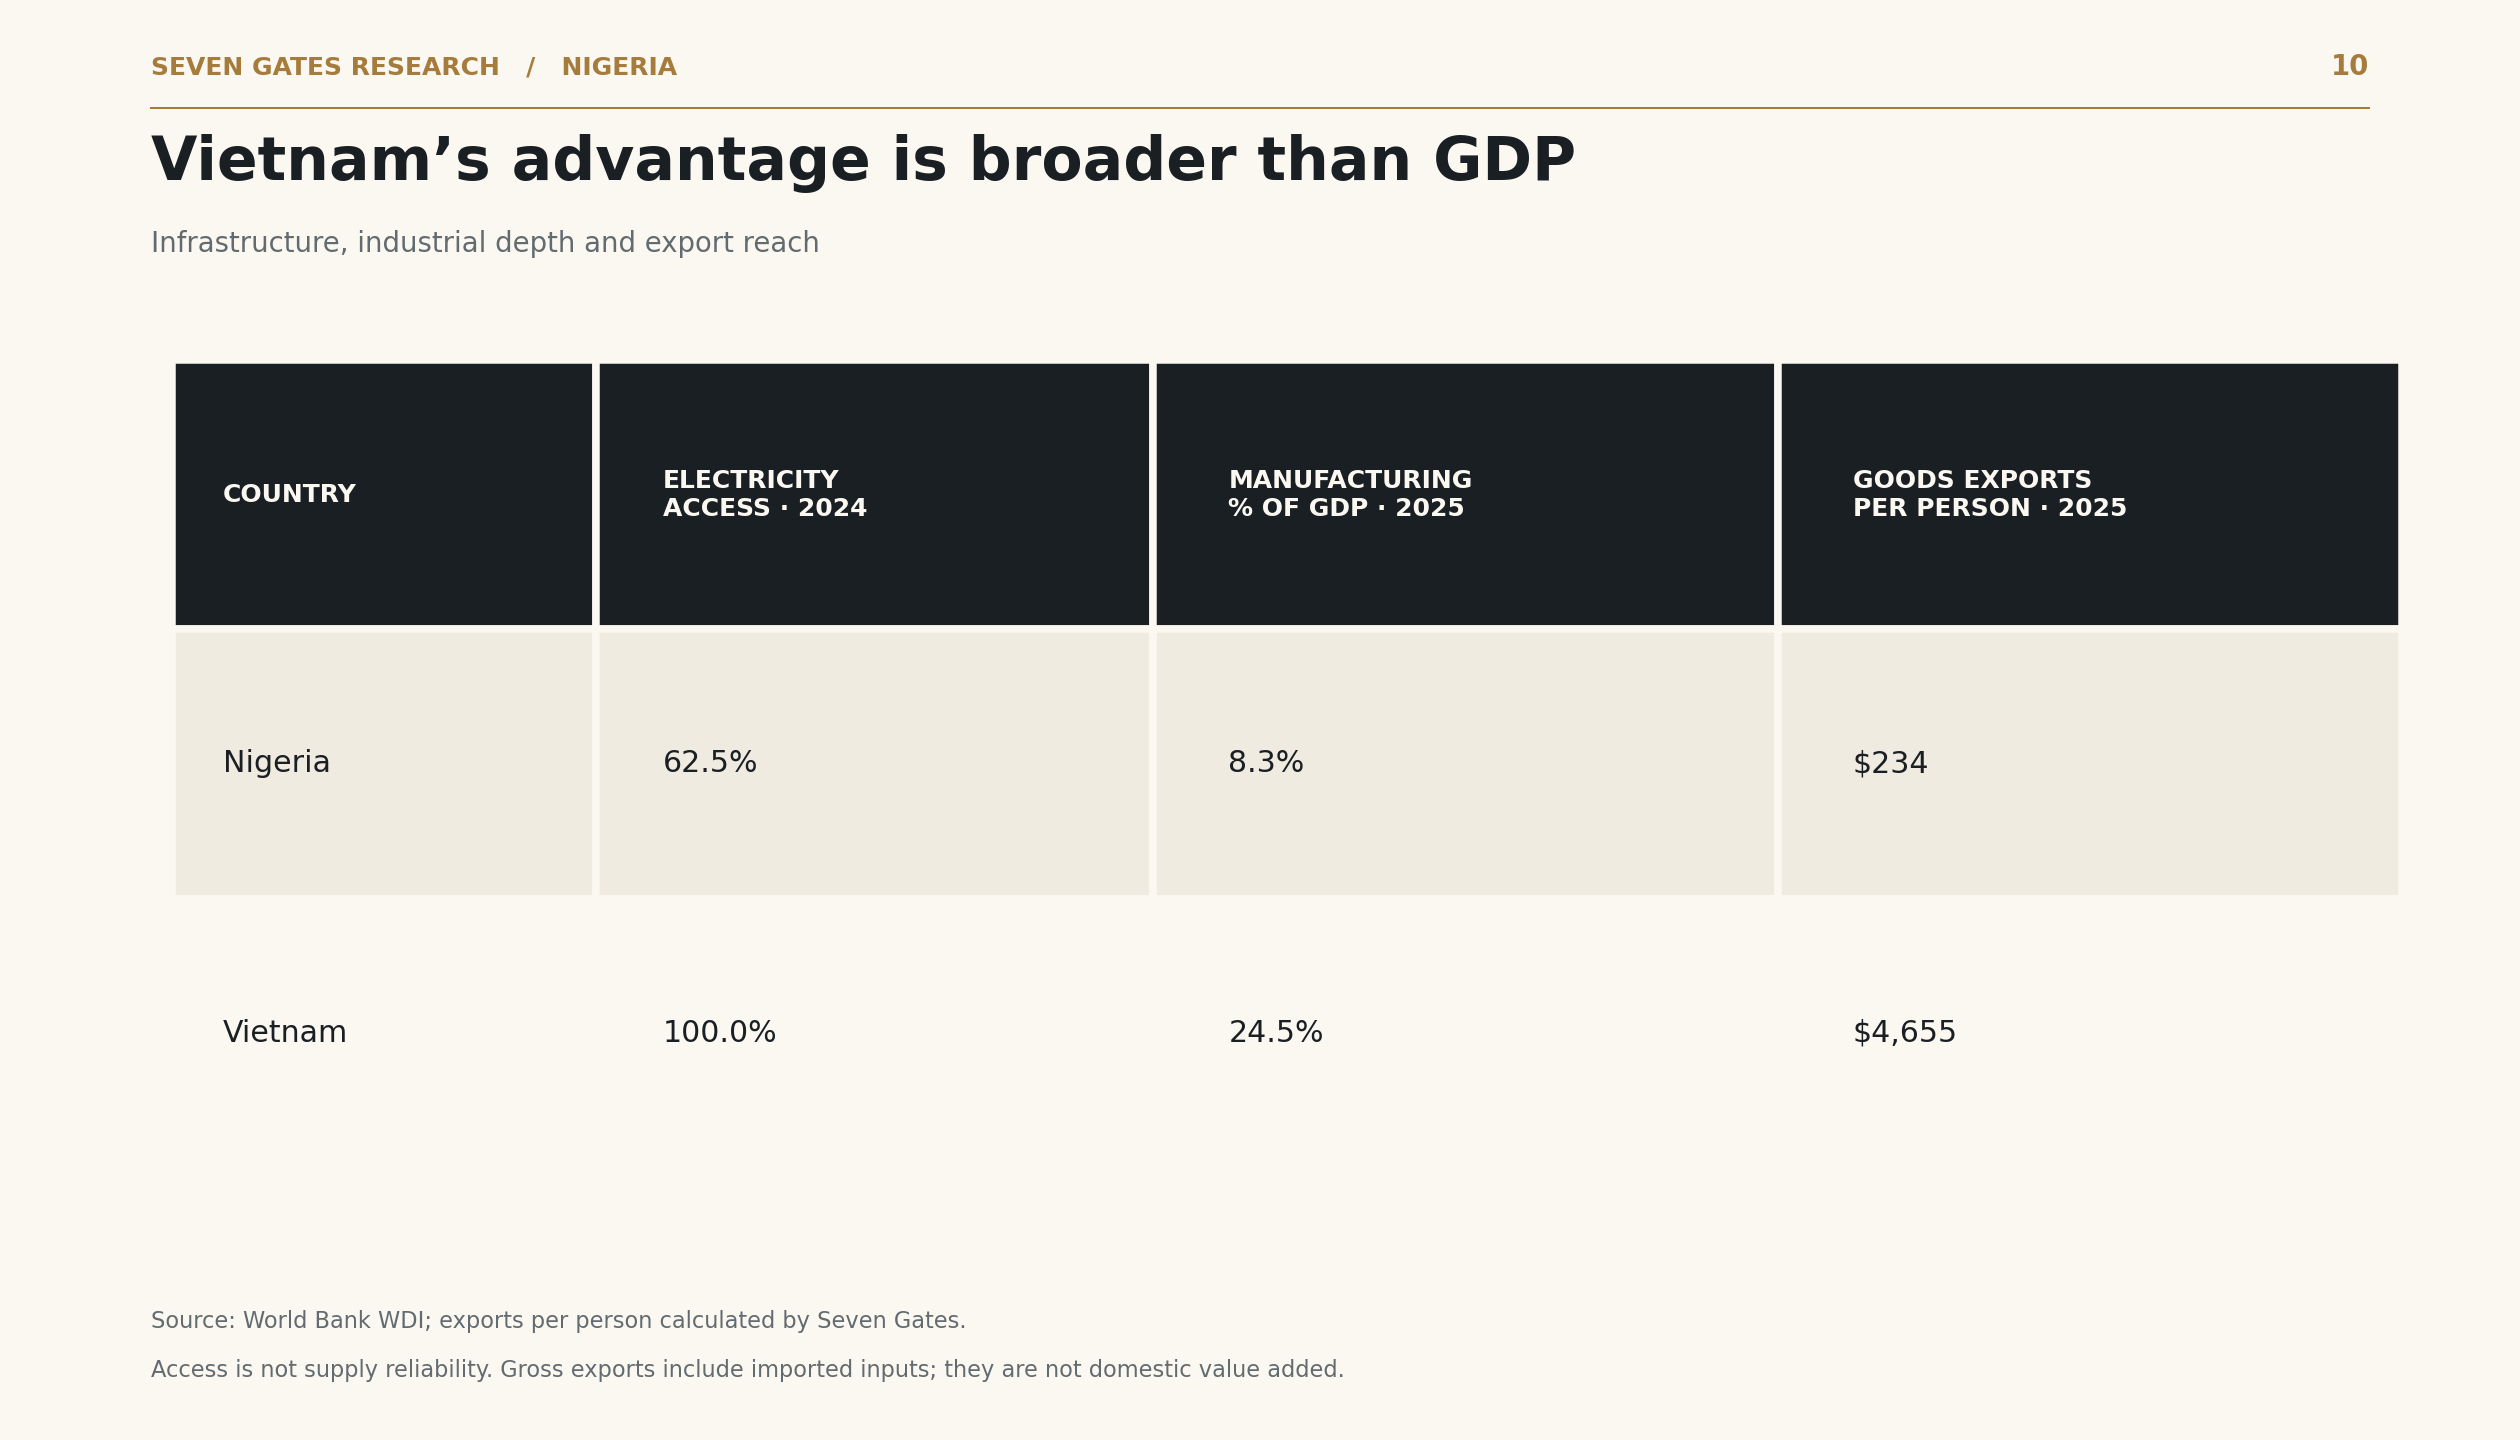
Read exhibit 10 as a table
| country | electricity 2024 | manufacturing share 2025 | goods exports pc 2025 |
|---|---|---|---|
| Nigeria | 62.5% | 8.3% | $234 |
| Vietnam | 100.0% | 24.5% | $4,655 |
Vietnam’s advantage is visible in electricity access, manufacturing and exports per person.
China and India: arithmetic with an impatient timetable
China began its modern reform era in 1978. Its long expansion combined changes in agriculture, industry, urbanisation, infrastructure, trade and technology. A joint World Bank and Chinese research report estimated that nearly 800 million people had moved above the then-used international extreme-poverty threshold of $1.90 a day in 2011 PPP terms over four decades. That is not the same as abolishing poverty under every income standard. World Bank, 2022.
Nigeria cannot reproduce China’s historical circumstances. It can understand compounding. At 9% GDP growth and 2.1% population growth, the illustrative doubling time for real output per person is about eleven years. At 4.43%, it is thirty-one. Three decades make the difference rather more visible than three percentage points do at a press conference.
India offers another useful test of ambition. It has federalism, informality, regional inequalities and democratic politics that are seldom accused of excessive quiet. In February 2025, the World Bank estimated that India would need average growth of 7.8% for twenty-two years to achieve high-income status by 2047, supported by stronger investment, productivity and participation in employment. This is a conditional development scenario, not an economic speed limit issued to other countries. World Bank: India’s 2047 ambition.
The lesson for Nigeria is that a demanding destination requires a demanding trajectory. Four percent can mark genuine recovery and still be inadequate to the scale of the task.
Botswana invested more of the inheritance
Botswana is useful because it complicates the easy version of the resource-curse argument. Diamond income helped finance infrastructure and human development under comparatively prudent institutions. The country became much richer. Natural wealth did not make that result automatic; its management mattered. World Bank: Botswana.
The sequel is equally important. Diamonds remain central, diversification is unfinished and unemployment is high. The WDI series records real GDP contractions of roughly 2.8% in 2024 and 0.7% in 2025. A successful development model can eventually become a constraint on the next stage. World Bank: Botswana GDP growth.
Botswana therefore offers evidence both for resource stewardship and against complacency. It converted more of its mineral advantage into durable public wealth, but still needs a broader productive economy. Nigeria has a larger and more complex country to govern; that limits mechanical comparison, not the relevance of saving windfalls and spending them competently.
There is no final policy setting at which the government may leave early. Even the countries that did the first part well are given more work.
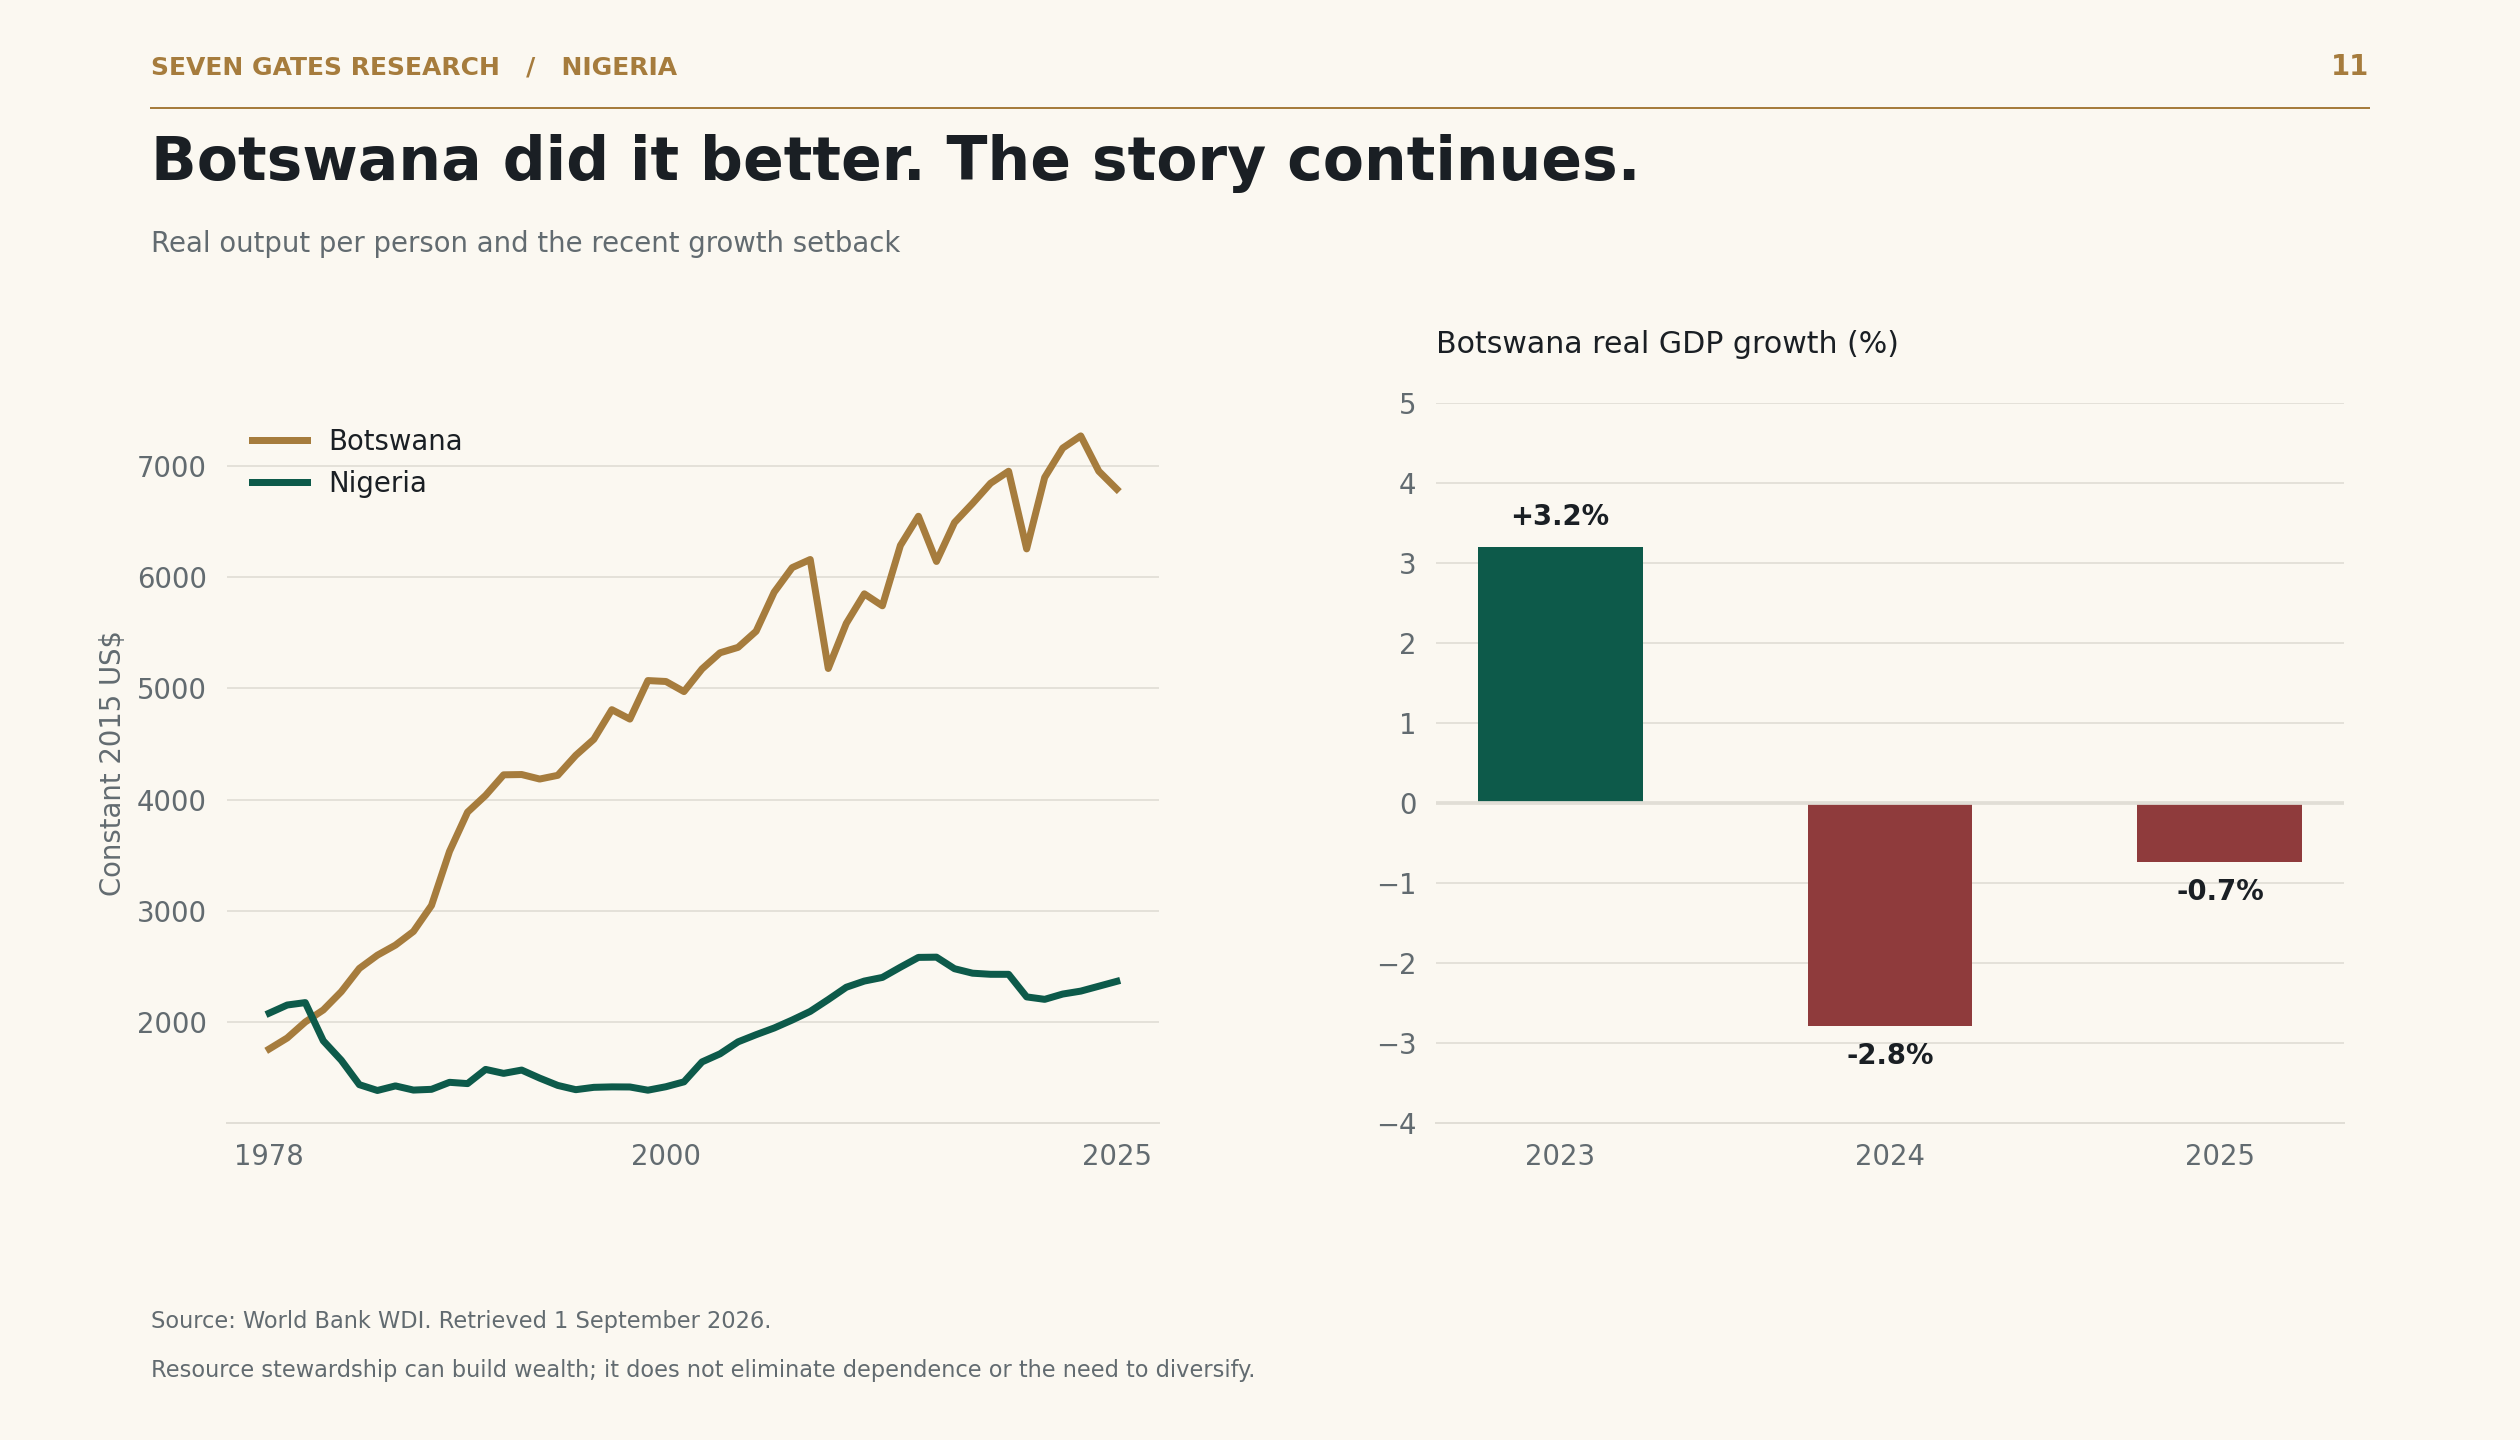
Botswana’s stronger long-run record does not remove the risks of dependence on one commodity.
What pace would begin to change the country?
No growth rate guarantees poverty reduction. Distribution, public services, the sectors expanding and the starting level of deprivation all matter. It would be wrong to claim that 4.43% cannot lift anybody out of poverty, just as it would be wrong to present it as evidence of broad transformation.
Seven Gates’ judgement is that sustained growth around 7–9%, if driven by productivity and a wider spread of opportunity, would better match Nigeria’s ambition. That is a demanding aspiration, not a forecast or a scientifically fixed threshold. Faster growth built on an unstable credit boom or one temporary oil surge could disappoint badly.
The scenarios below hold annual real GDP growth at different rates while assuming population growth gradually falls from 2.1% in 2027 to 1.8% in 2046. They do not estimate the investment, institutions or policy changes needed to deliver those paths. They show the prize, not a completed financing plan.
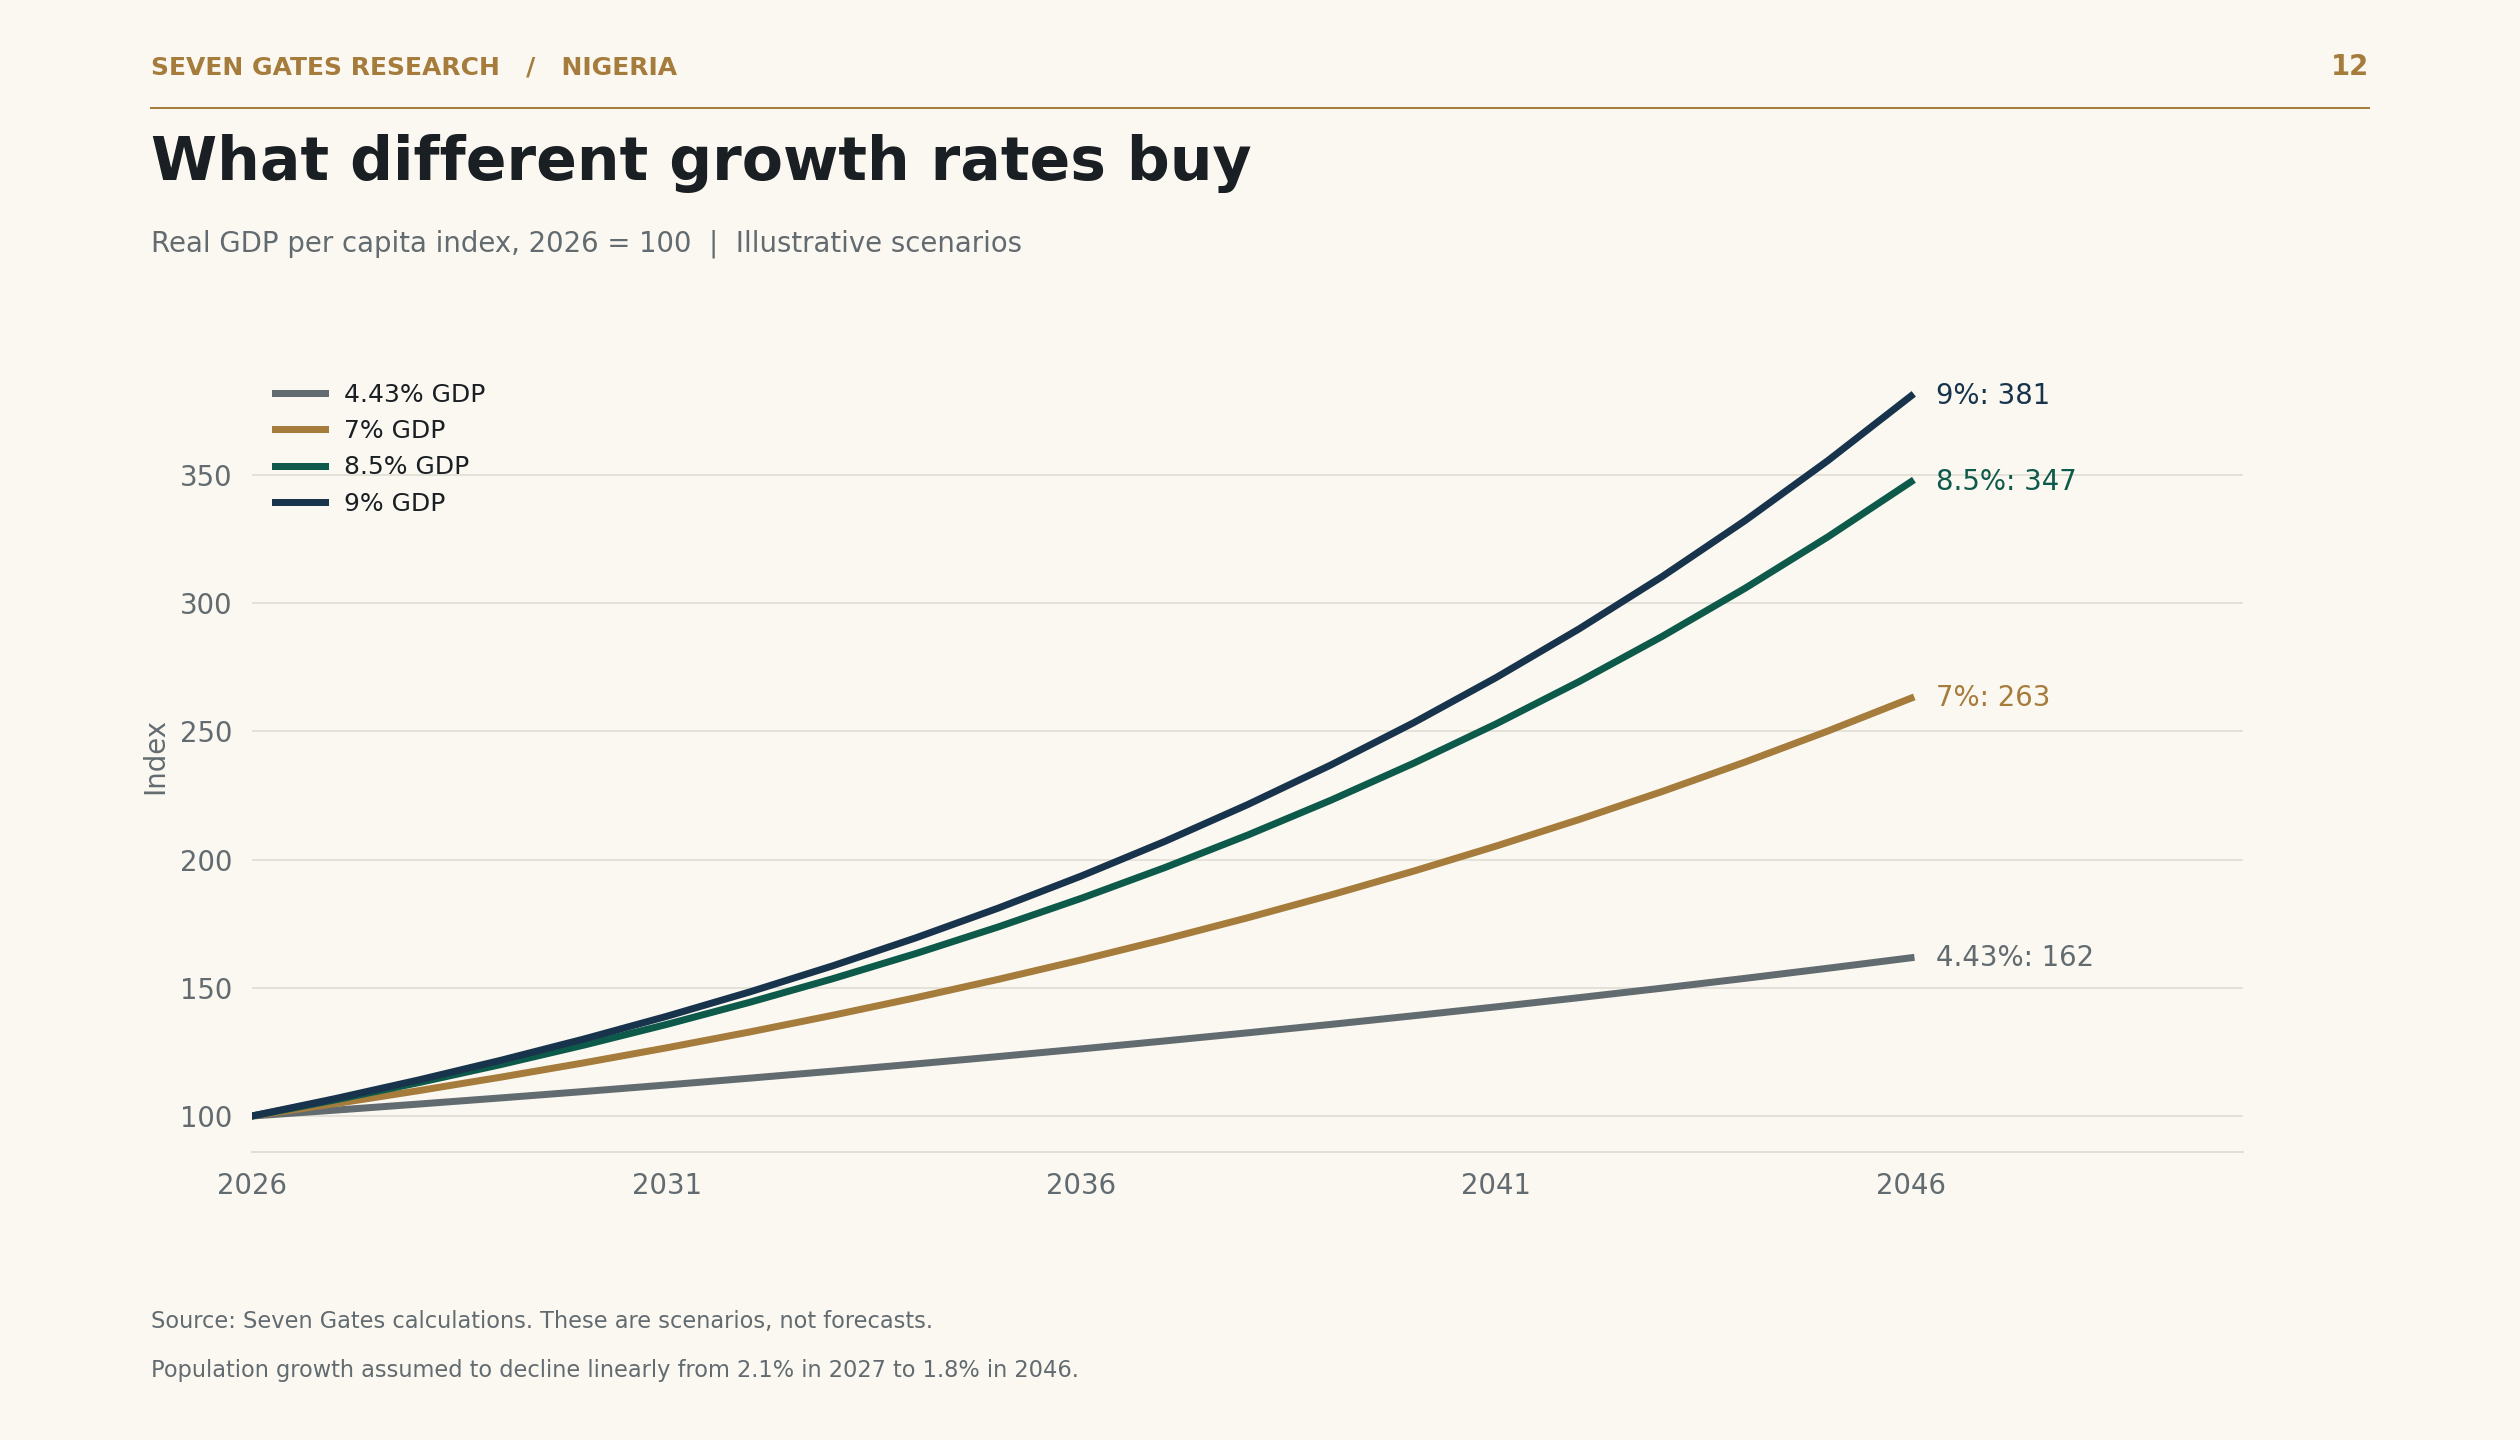
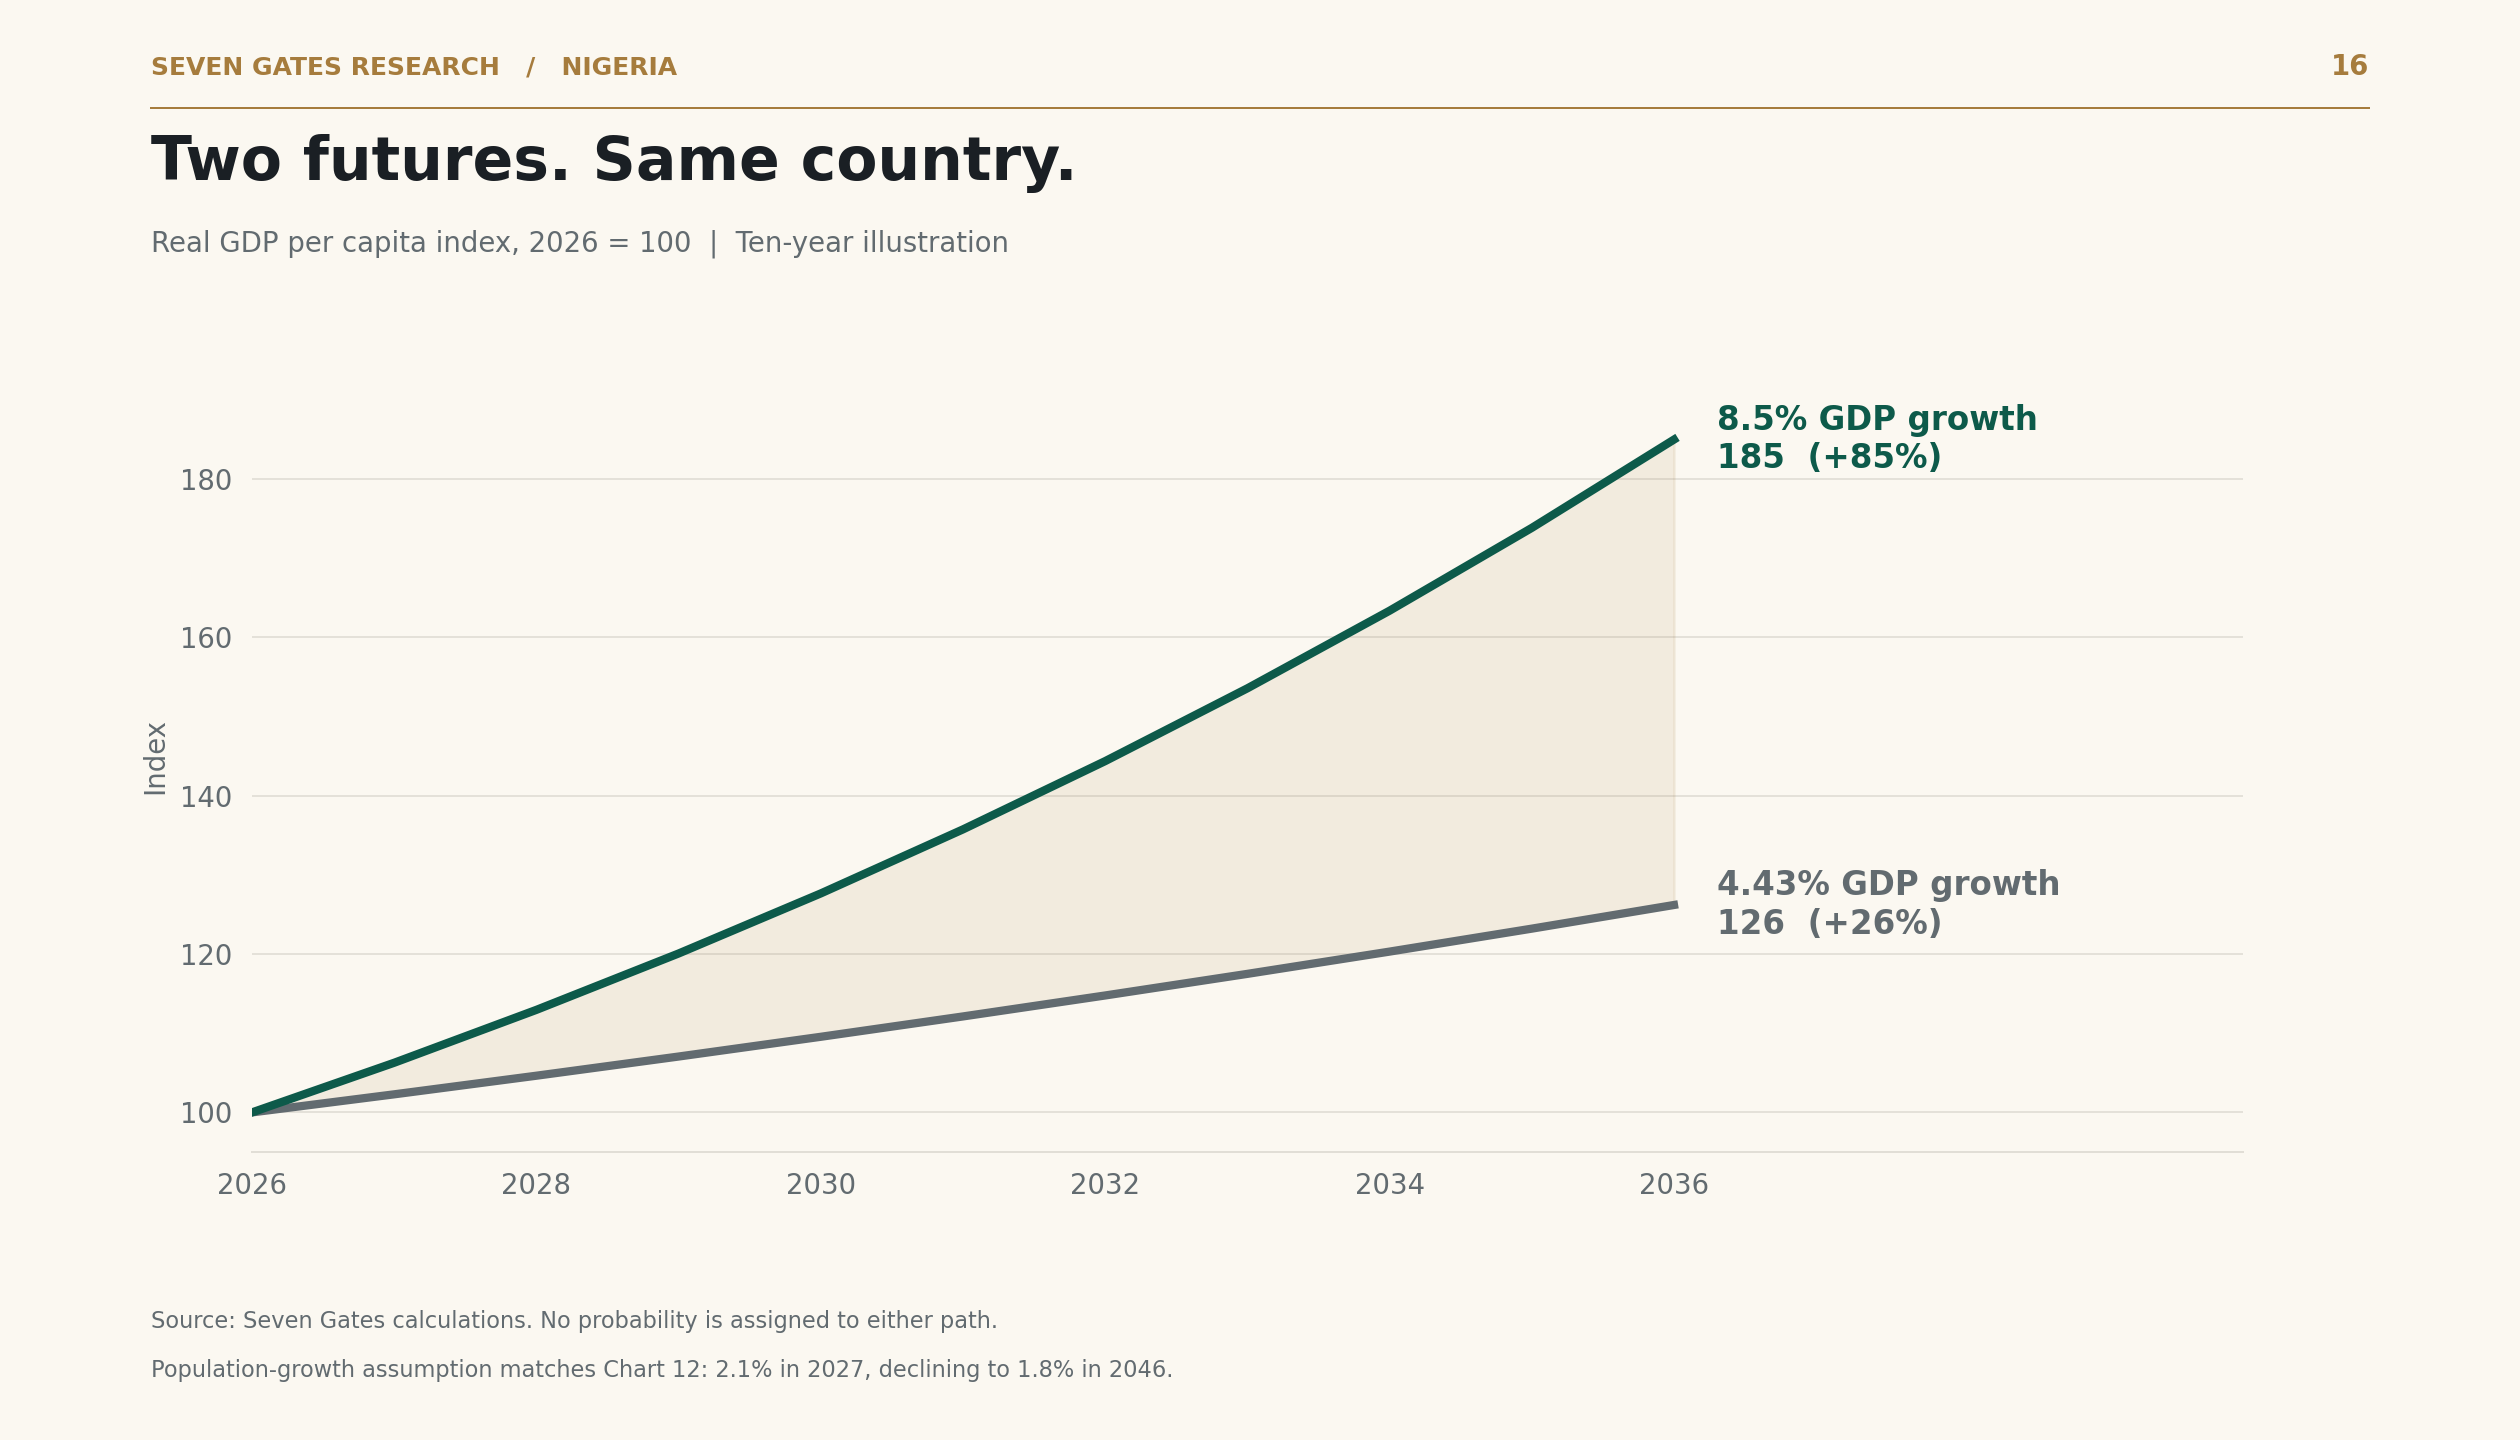
The same explicit demographic assumption applies to every path. None is assigned a probability.
A trillion-dollar economy for whom?
Economic scale matters. A larger productive base can sustain stronger companies, deeper capital markets and a broader tax base. But a current-dollar GDP target needs to disclose how the country arrives there.
Real production can expand. Domestic prices can rise. The exchange rate can strengthen. Statistical coverage can improve. These channels can operate together, and a legitimate rebasing can reveal activity that was previously missed. It does not cause that activity to spring into existence on publication day.
An appreciation may improve purchasing power over imports, while an inflation-led increase in nominal GDP may coexist with falling real wages. The welfare effects are different. Even productivity-led growth requires attention to distribution and public services.
In its June 2026 review, the IMF reported poverty at approximately 63% on the national poverty line, and estimated that 27 million Nigerians faced food insecurity in the autumn of 2025. These are different measures, covering different concepts. The poverty figure should not be confused with Nigeria’s separate 2022 multidimensional-poverty statistic, which also rounded to 63%. IMF Nigeria Article IV, June 2026.
There is no need to improve those numbers rhetorically. A trillion-dollar economy with persistent mass deprivation is entirely possible. The useful target is what its workers and households can afford, learn and build when it gets there.
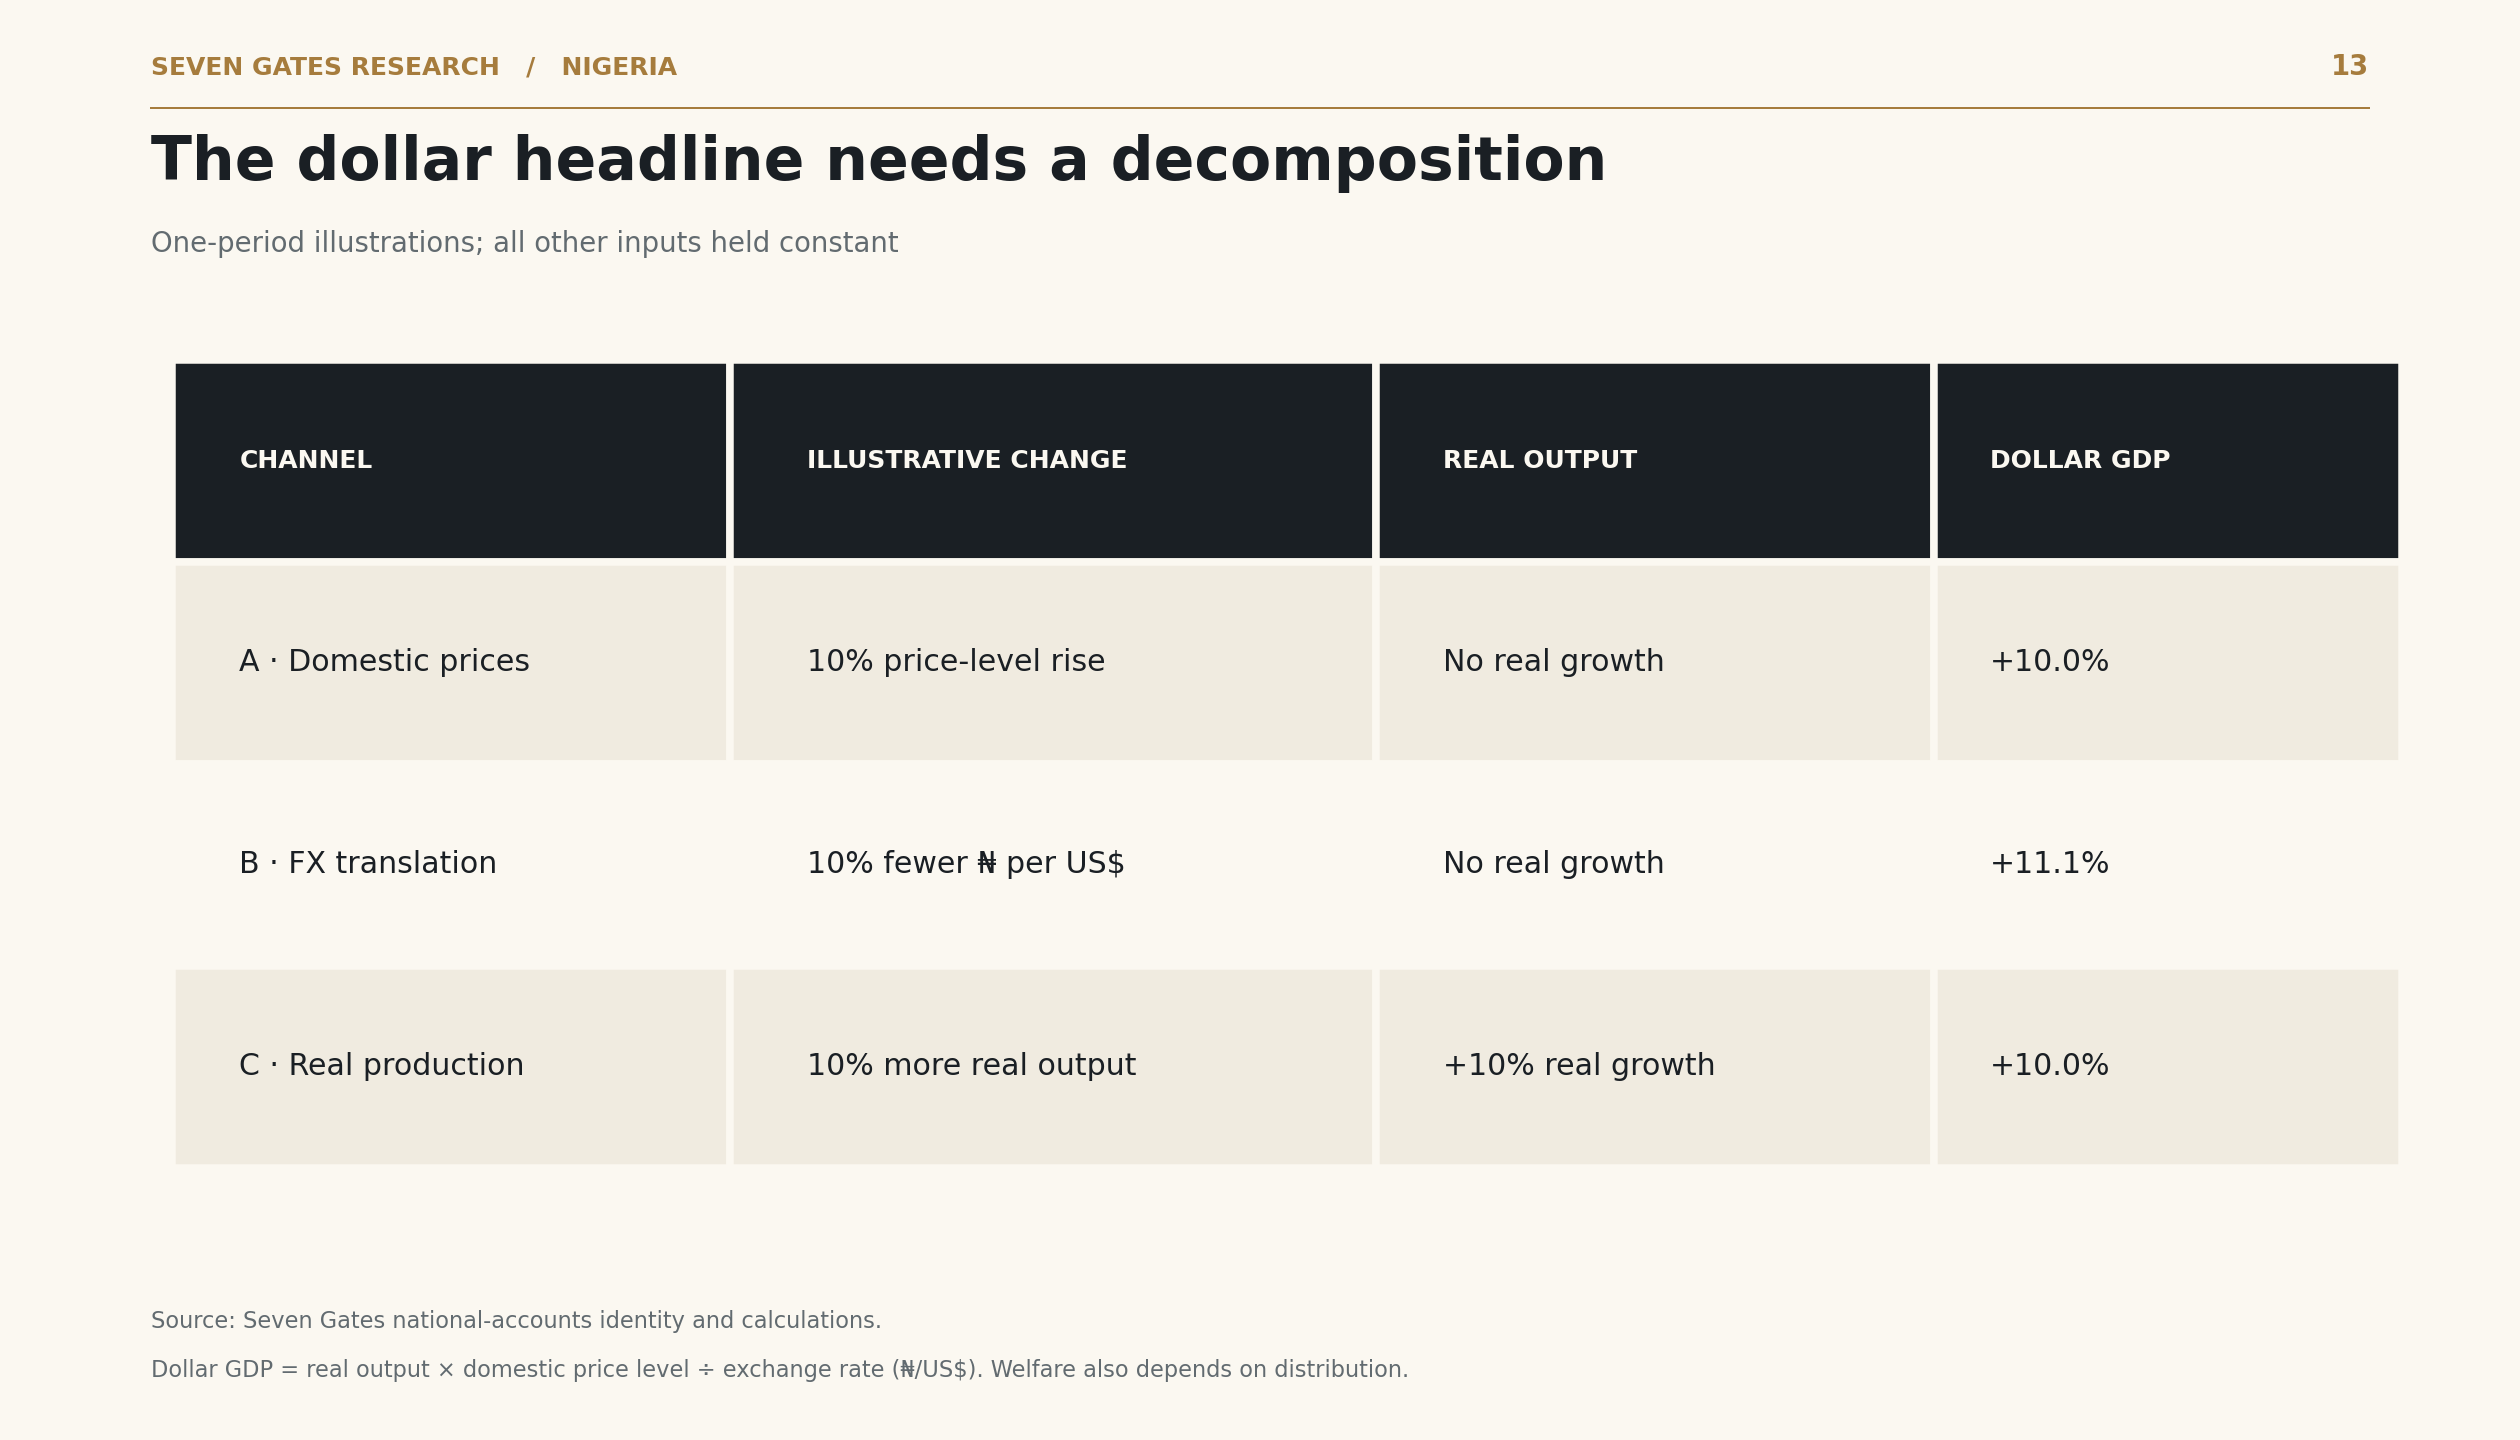
Read exhibit 13 as a table
| channel | change | real output | dollar gdp |
|---|---|---|---|
| A · Domestic prices | 10% price-level rise | No real growth | +10.0% |
| B · FX translation | 10% fewer ₦ per US$ | No real growth | +11.1% |
| C · Real production | 10% more real output | +10% real growth | +10.0% |
Inflation, exchange-rate translation and real production can all lift dollar GDP; their welfare implications differ.
Each illustration changes one input and holds the others fixed. A 10% fall in naira per dollar raises dollar translation by 11.1%, not 10%.
Human capital is part of the machinery
Factories need technicians; hospitals need nurses; modern farms need agronomy, logistics and equipment maintenance. Firms need people who can read instructions, diagnose faults, manage inventories and improve a process that worked well enough last year.
Nutrition, schooling and health determine how much of that capacity is available. They are investments in future production as well as ends worth pursuing in themselves. Human development is not something a country postpones until after it becomes rich.
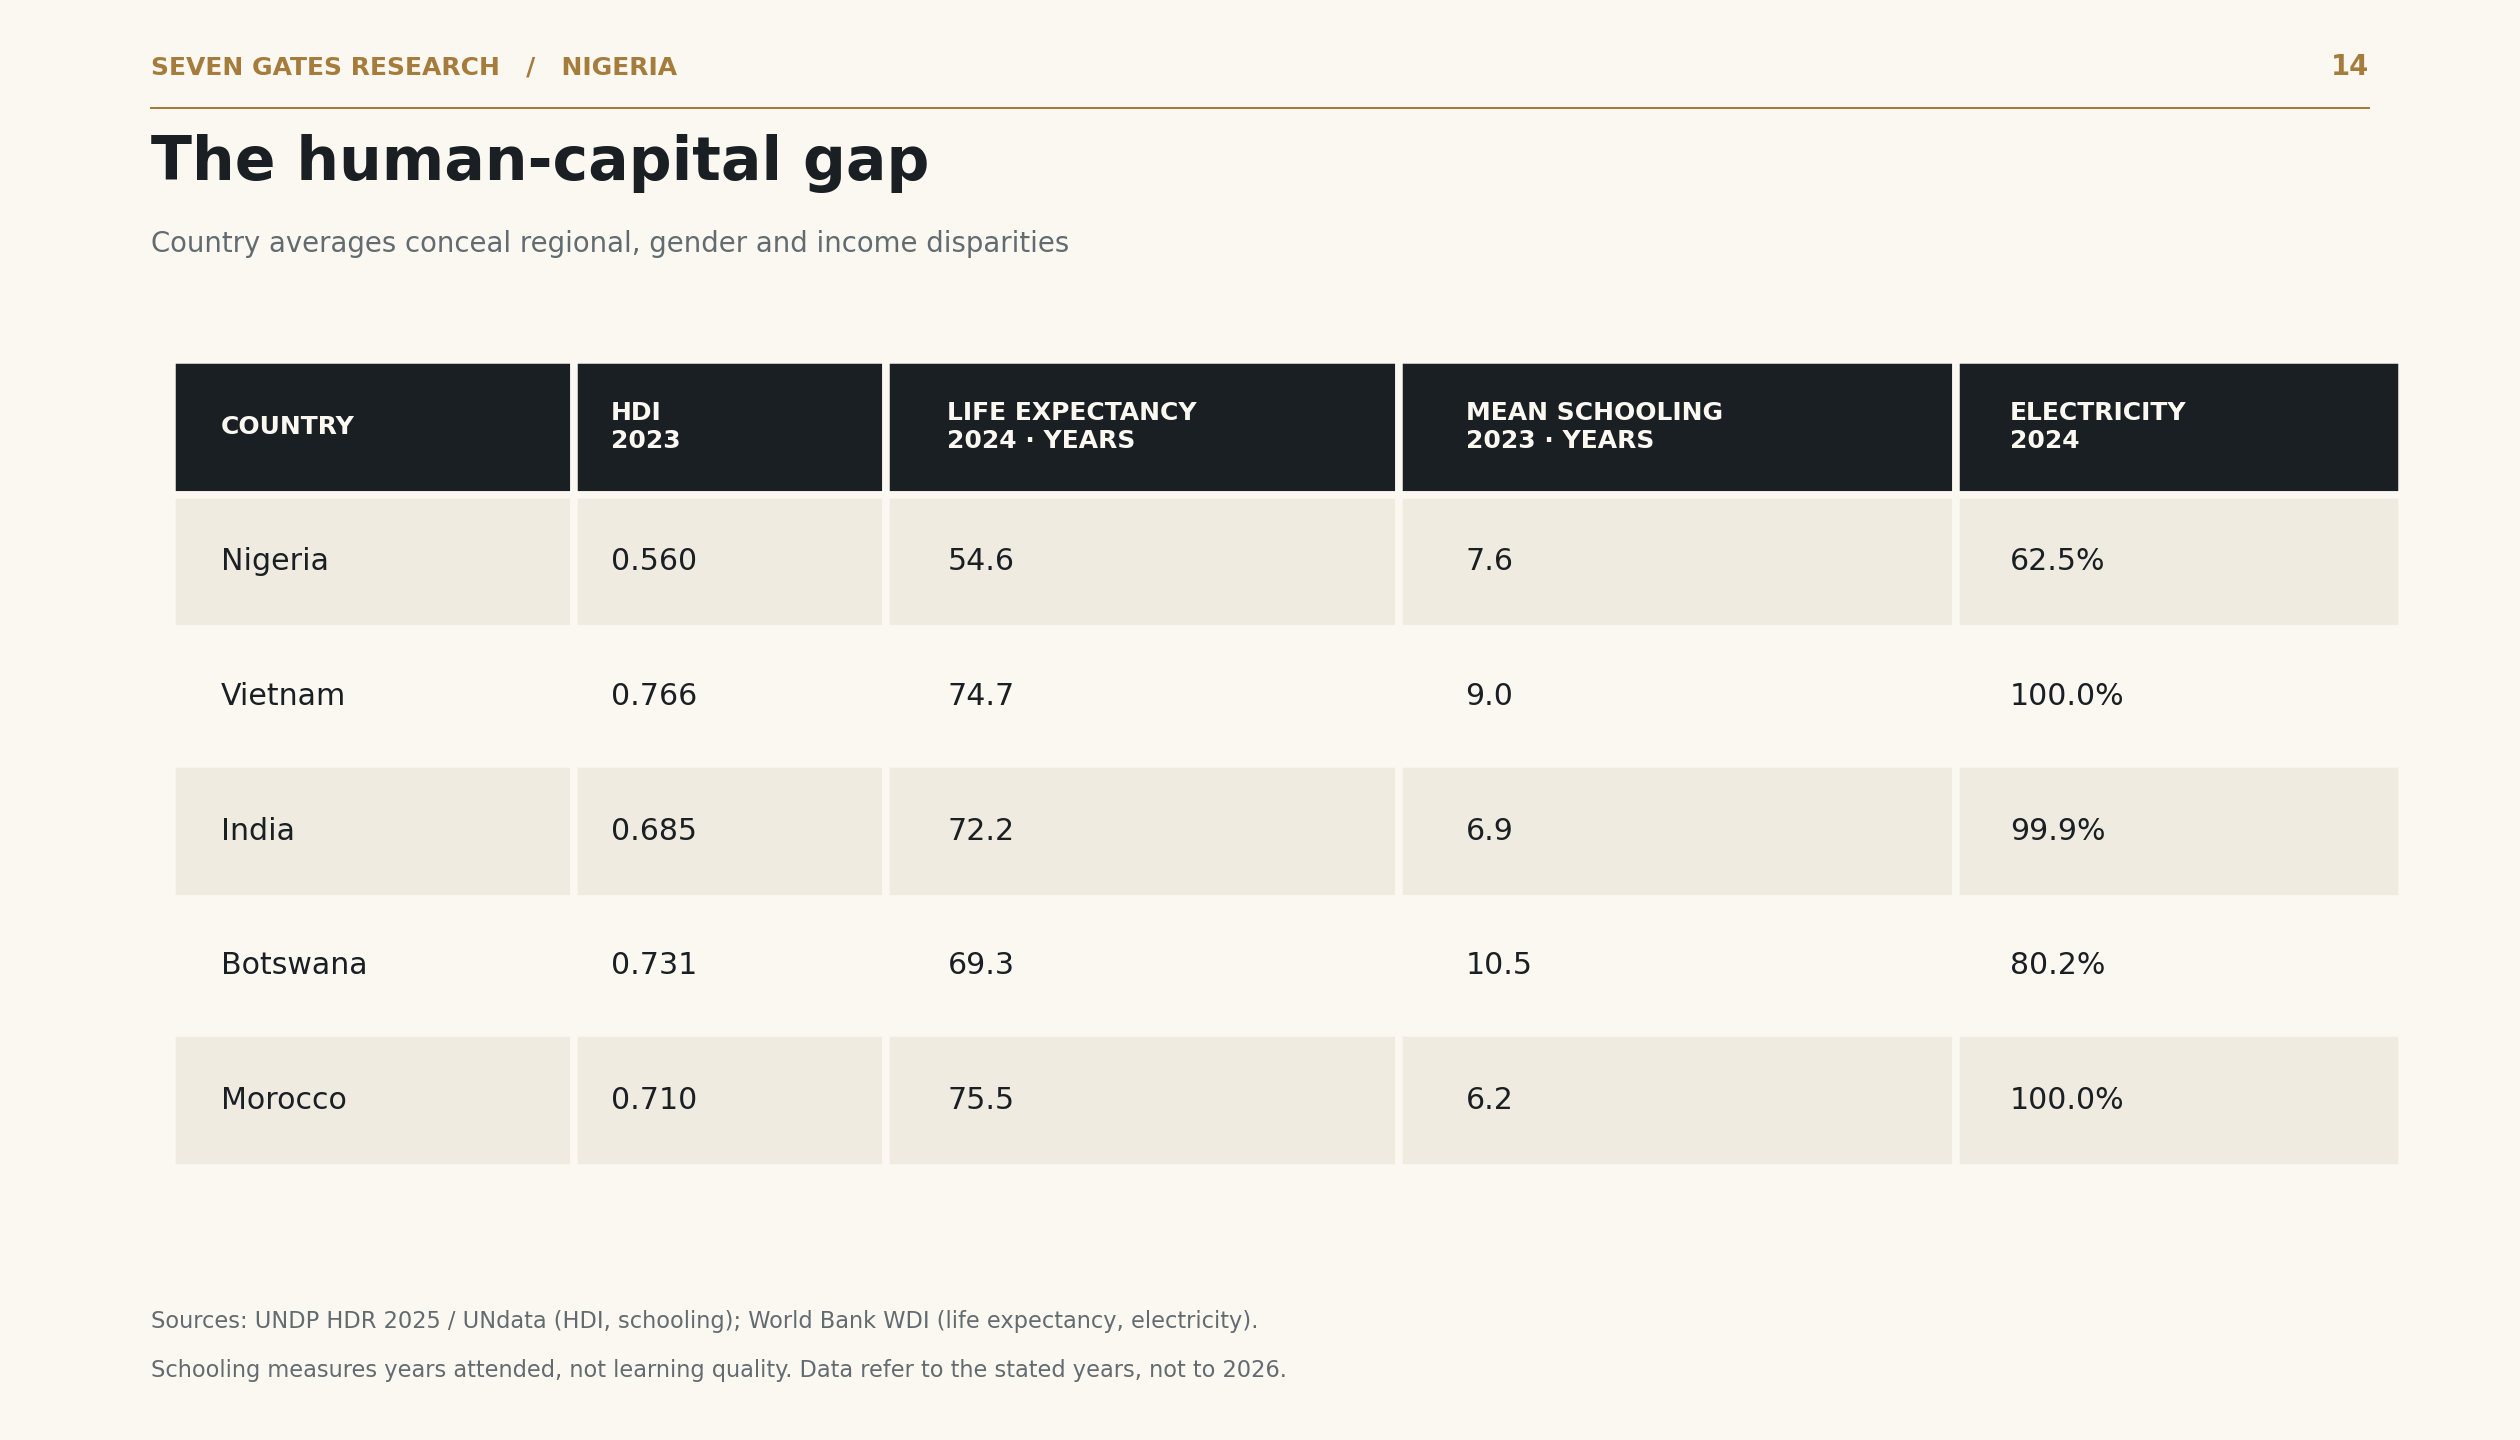
The comparisons below show Nigeria’s weak life expectancy, electricity access and overall Human Development Index. They also contain a qualification worth keeping: Nigeria’s recorded mean years of schooling exceed those of India and Morocco in this dataset. Time in school does not measure learning, and a national average conceals enormous variation. The evidence is stronger when it does not pretend every column says the same thing. UNDP HDI and components, 2023 data, World Bank: life expectancy.
Read exhibit 14 as a table
| country | hdi 2023 | life expectancy 2024 | mean schooling 2023 | electricity 2024 |
|---|---|---|---|---|
| Nigeria | 0.560 | 54.6 | 7.6 | 62.5% |
| Vietnam | 0.766 | 74.7 | 9.0 | 100.0% |
| India | 0.685 | 72.2 | 6.9 | 99.9% |
| Botswana | 0.731 | 69.3 | 10.5 | 80.2% |
| Morocco | 0.710 | 75.5 | 6.2 | 100.0% |
Nigeria’s higher mean schooling than India or Morocco does not offset its lower life expectancy and electricity access.
HDI and schooling are from the 2025 Human Development Report and refer to 2023. Electricity and life expectancy use 2024 WDI observations.
Japa is partly a referendum conducted with passports
A Nigerian engineer does not become several times more intelligent between departure and Heathrow Immigration. The system around the engineer changes: power, equipment, finance, management, research, reliable rules and a market able to pay for the resulting output.
Migration decisions also involve family, safety, professional development and personal preference. They cannot be reduced to GDP. But the productivity differential explains part of the pull. The same talent can generate more value when complementary capital and institutions work better.
That makes the customary lecture about patriotism an incomplete response. The more productive question is why home provides so little support to abilities that become valuable elsewhere. A successful economy gives skilled citizens a credible option to stay, and those who leave a credible option to return.
The reforms are real. The next assignment is harder.
Nigeria’s recent reforms have improved important parts of its macroeconomic position. The IMF’s June 2026 review recognised greater stability and resilience, while identifying governance, security, electricity, infrastructure, agriculture and human capital as priorities for inclusive growth. Recognition of the first does not require overlooking the second. IMF Nigeria Article IV, June 2026.
Better currency pricing and public finances can reduce uncertainty and support investment. Their value ultimately depends on what follows: goods reaching markets, machinery operating, productive firms obtaining finance, children learning and households retaining more purchasing power.
Electricity regulation can improve while power supply remains unreliable. A tax law can be better designed while collection remains arbitrary. A capital budget can be announced in full and delivered in instalments of hope. The execution measures matter at least as much as the reform titles.
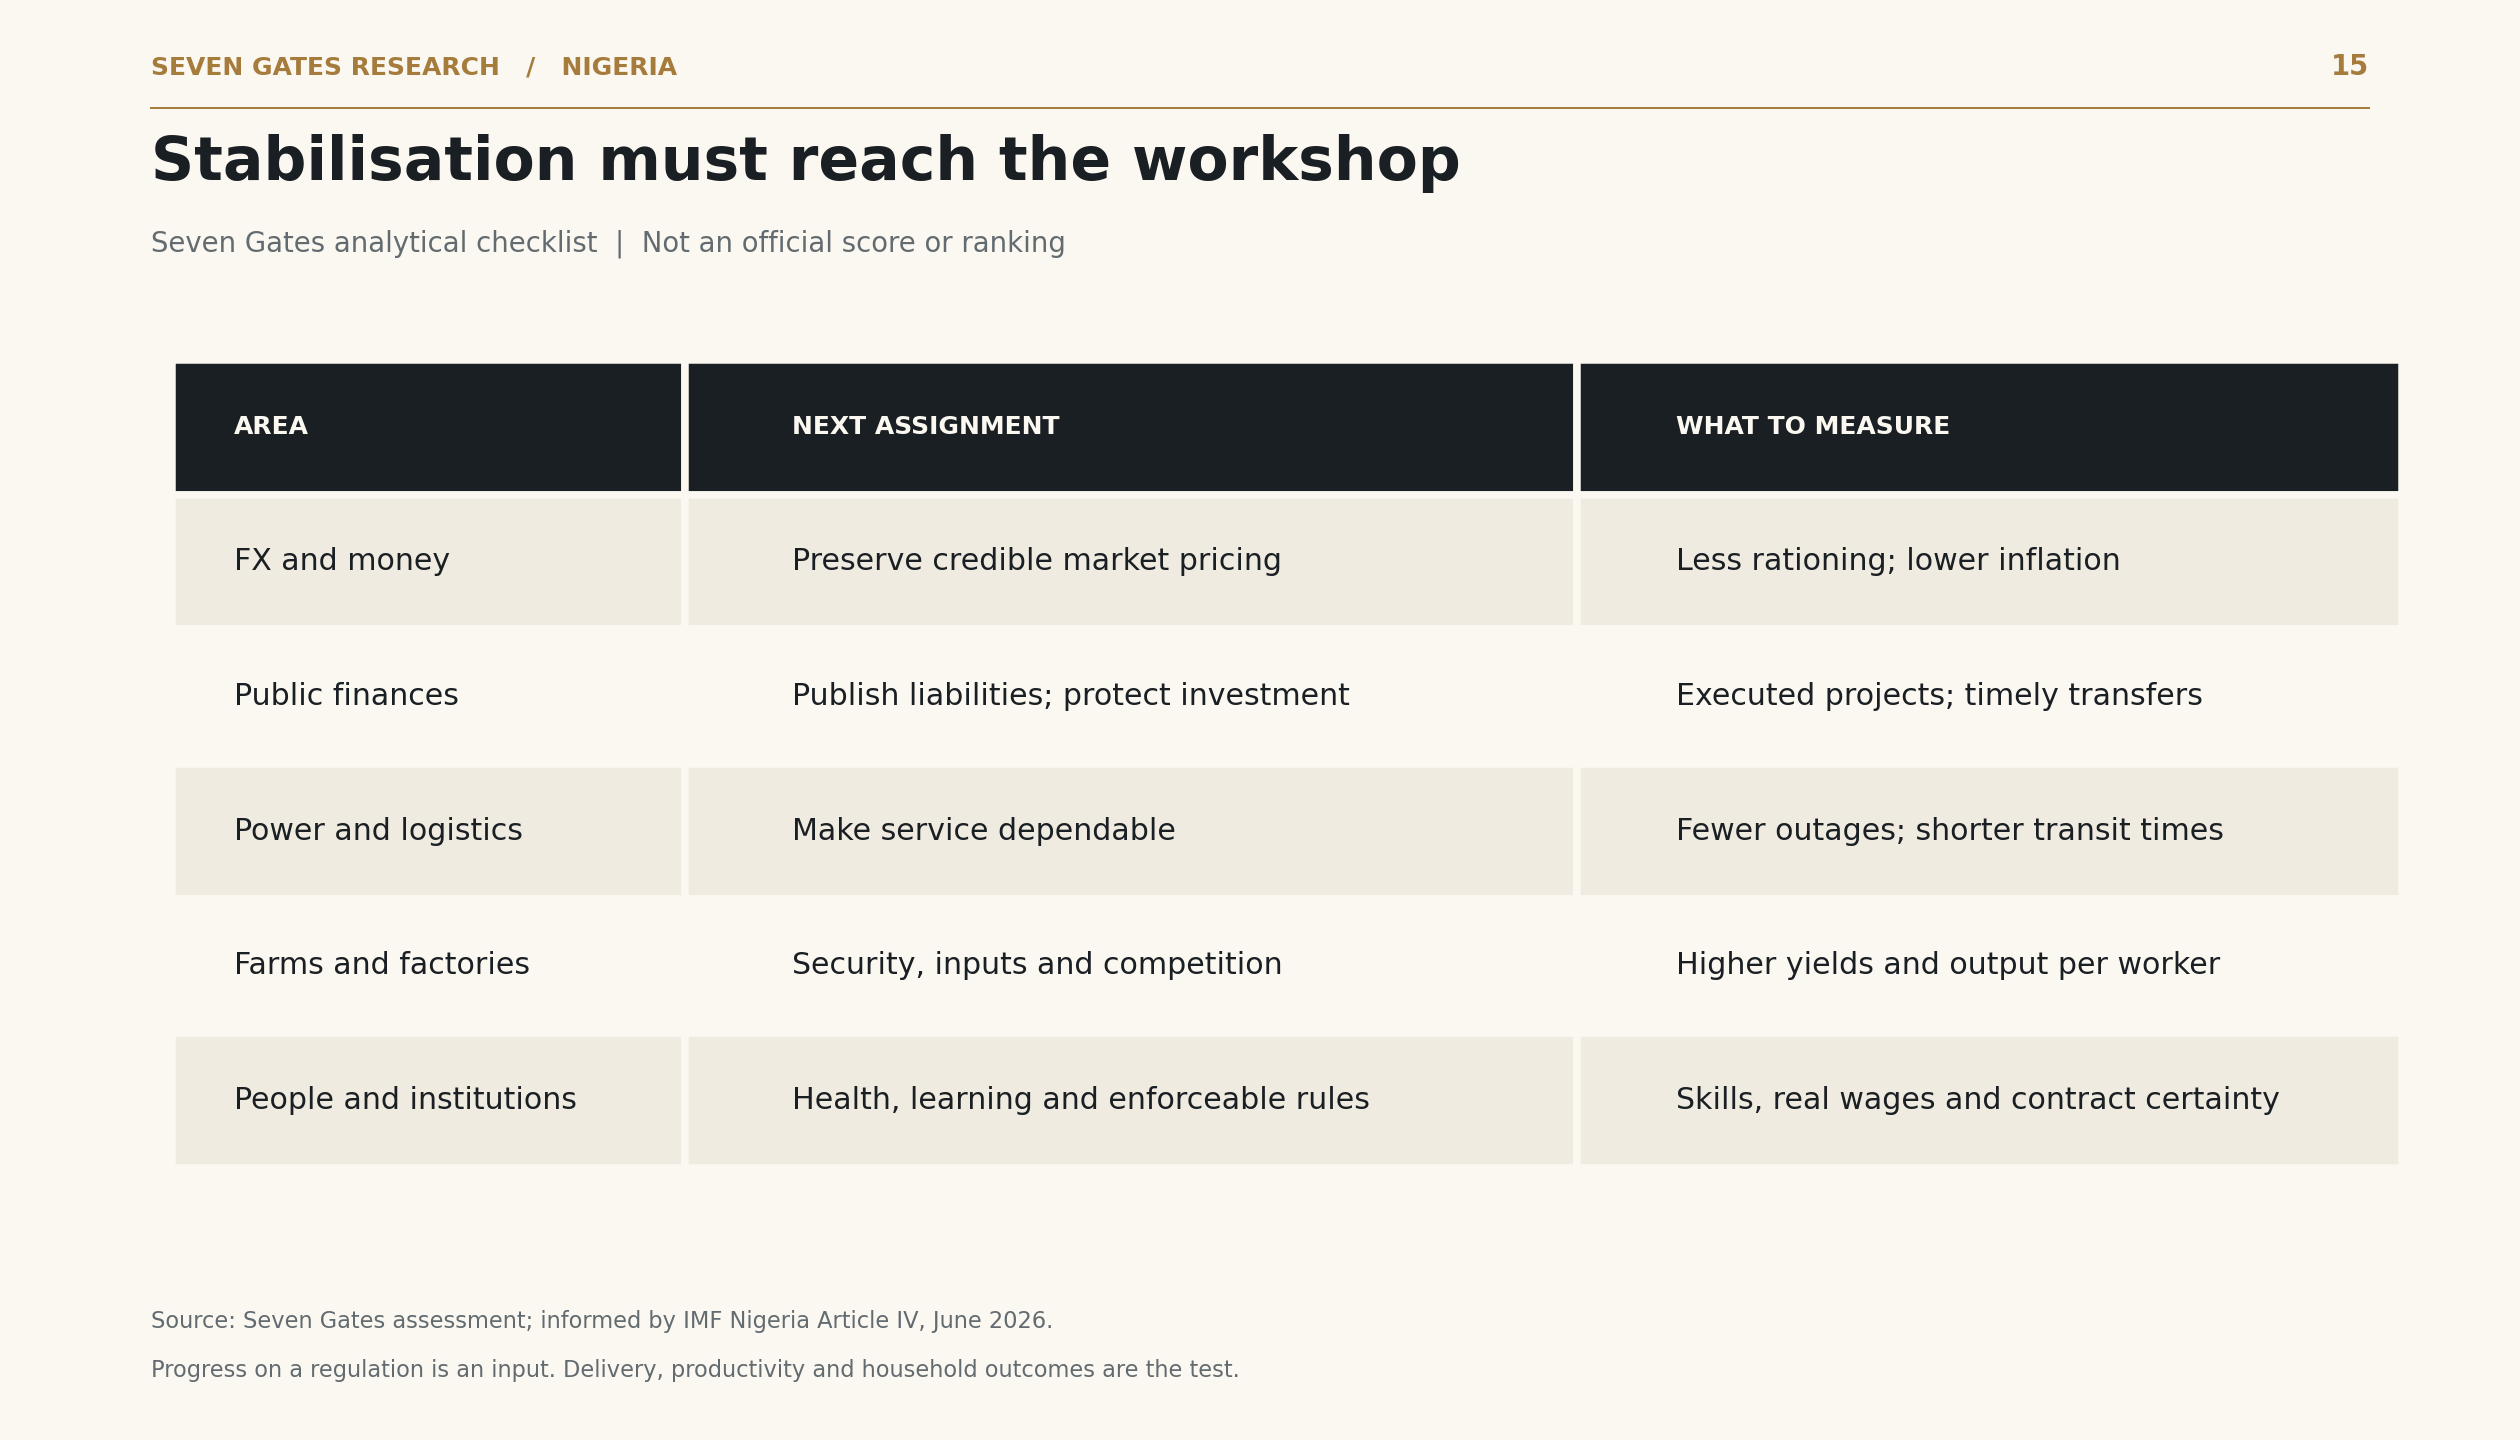
The assignment is familiar: safer farms and roads, dependable power, less costly logistics, healthier people, stronger learning, competitive markets and contracts enforceable without knowing a senator. Familiarity has never been the missing input.
Read exhibit 15 as a table
| area | assignment | measure |
|---|---|---|
| FX and money | Preserve credible market pricing | Less rationing; lower inflation |
| Public finances | Publish liabilities; protect investment | Executed projects; timely transfers |
| Power and logistics | Make service dependable | Fewer outages; shorter transit times |
| Farms and factories | Security, inputs and competition | Higher yields and output per worker |
| People and institutions | Health, learning and enforceable rules | Skills, real wages and contract certainty |
The test of reform is what firms and households can do with it.
An analytical checklist, not an official rating. The outcomes are the test.
Two futures, with the same people
Suppose Nigeria could sustain 8.5% annual real GDP growth for the next decade, under the same gradually declining population-growth assumption used earlier. Real output per person would rise by approximately 85%. At a sustained 4.43%, it would rise by roughly 26%.
Neither path is promised. The faster one would require much stronger investment and productivity, and a long sequence of competent decisions. It is worth considering because it gives the policy debate a scale. The gap could mean more room for wages, housing, savings, healthcare and fiscal capacity, though the translation into each outcome would depend on distribution and policy.
Nigeria would remain recognisably Nigerian. Oil prices would move; politics would remain lively; someone would still discover an urgent reason to convene a committee. Development has not abolished human nature anywhere else.
But sustained progress would change the choices. A graduate deciding whether to leave could weigh two viable careers, rather than treating departure as the opening item in an economic evacuation plan.
The number can be good and the task unfinished
Nigeria’s 4.43% Q2 growth is good news. Dismissing it because households remain under pressure would confuse the measurement with the problem it only partly describes. Promoting it as proof of transformation would make the opposite mistake.
The longer record is harder to celebrate: real output per person only modestly above its 1978 level, still below the 2014–15 peak, and widespread deprivation alongside impressive individual businesses and industries. These facts can occupy the same country without contradiction.
Vietnam demonstrates the gains from sustained industrial and institutional learning. China demonstrates the scale at which productivity growth can change living standards. India shows how demanding the required pace can remain even after substantial progress. Botswana shows both the value of prudent resource management and the need to keep adapting after it succeeds.
Nigeria contributes an especially uncomfortable lesson. We have already grown rapidly, opened industries to investment, attracted capital and seen real output per person rise substantially. The country does not lack evidence that useful policy can work.
It lacks a sufficiently long, sufficiently broad run in which those gains survive the next oil shock, political transition and administrative reinvention. Forty-seven years is a long time to remain so good at starting again.
The latest GDP release is a reason to continue the work. Nigerians will know it has succeeded when the improvement requires less explanation.
Sources and calculation notes
Original data cut-off: 1 September 2026; trillion-dollar fact check added 2 September 2026. Historical charts use one World Bank WDI extraction through 2025; quarterly GDP and monthly CPI use separately dated NBS releases or attributed reporting. The new dollar-target exhibit uses the separately identified IMF 2026 estimate and illustrative assumptions disclosed beside it. WDI annual growth at market prices and NBS headline production-side growth can differ in valuation basis, revision vintage and coverage. The article does not splice them into a single quarterly-to-annual growth series.
History and units. Real GDP per capita uses NY.GDP.PCAP.KD, explicitly labelled constant 2015 US dollars by WDI. Total real-output indices are reconstructed as per-capita output multiplied by population (SP.POP.TOTL). National accounts and population estimates are revised; changes of coverage, rebasing and historical links limit exact comparisons across decades. These are the published linked series, not an independent reconstruction of every vintage. Cross-country constant-dollar values are not PPP-adjusted welfare comparisons.
Per-person arithmetic. Annual growth per person equals (1 + real GDP growth) / (1 + population growth) − 1. Doubling time is ln(2) / ln(1 + per-person growth). Chart 2 fixes population growth at 2.1%. Charts 12 and 16 use the same illustrative linear decline from 2.1% in 2027 to 1.8% in 2046. The paths start at an index of 100 in 2026; they do not assume that a measured annual 2026 GDP level is already available.
Labour and welfare. Q2 2024 labour figures retain their survey date and different denominators. They are not added or presented as current 2026 estimates. HDI and schooling refer to 2023; electricity and life expectancy refer to 2024. The 63% national-line poverty estimate is distinct from the NBS multidimensional-poverty measure. Electricity access does not establish reliability; years of schooling do not establish learning quality.
Interpretation. Counterfactual policy discussion, the preferred development pace and the reform checklist are Seven Gates judgements. The scenario paths are arithmetic illustrations, not forecasts or estimates of poverty reduction. The 1978 starting point reflects the essay’s historical framing; choosing a different starting year changes the measured long-run gain.
Principal source links: World Bank WDI; NBS GDP catalogue; NBS Labour Force Survey Q2 2024; July 2026 CPI reporting; IMF Nigeria 2026 consultation; UNDP data documentation; UNdata HDI table.
Important information
This publication is for informational and educational purposes only. It is not financial, investment, tax or legal advice, and is not a recommendation, offer or solicitation to buy or sell any security or financial instrument. Estimates, scenarios and opinions may change without notice. Sources believed to be reliable may contain errors or be revised. Readers should conduct their own research and consult qualified professional advisers before making investment decisions.