SEVEN GATES RESEARCH · COMPANY RESEARCH
SAHCO: More Passengers. Less Margin?
Nigeria's airports are busier. SAHCO and NAHCO are both collecting more revenue. Only one is currently turning the aviation boom into markedly more profit.

By The Lokoja Contrarian · 28 September 2026 · SAHCO / SKYAVN · Data cut-off: 25 September 2026
SAHCO price
₦171.20
SAHCO H1 PAT
₦3.85bn · −52.7%
NAHCO H1 PAT
₦10.85bn · +22.2%
There are two kinds of Nigerian domestic passenger: the person booked on the first flight, and the person who has begun negotiating directly with God.
The first leaves Lagos at 6:45 a.m. The second is still at the gate at 2:17 p.m., has eaten one meat pie of uncertain provenance, knows the customer-service manager by his first name and is receiving WhatsApp messages asking whether he has reached Abuja. He has not. Abuja, by this point, is less a destination than a theological proposition.
Which brings us, naturally, to SAHCO.
I have gone on about NAHCO before and still maintain a long-standing beef with the Nigerian airport ecosystem. Recent passengers have been considerably less philosophical. This weekend, reports and video showed passengers protesting Air Peace disruptions in Abuja. Earlier, the NCAA intervened after a Lagos-Enugu flight scheduled for 6:45 a.m. was moved to 4:50 p.m. Ten hours is not so much a delay as an unexpected tenancy agreement with the terminal.
None of that proves SAHCO or NAHCO caused the disruption. Airlines, fuel, weather, airport infrastructure, security and ground handlers occupy different parts of the machine. The passenger experiences only the airport.
01 · Traffic is rising. FAAN appears to have checked in twice.
At the ACI Africa conference in Abuja on 22 September, FAAN said Nigeria handled more than 18.8 million passengers in 2025, up 11.9%. Earlier FAAN-linked reporting put the same year nearer 17.94 million, up 5.9%. Another statement put domestic passengers above 10.5 million, up 10%, while September 2026 scheduled seats were reported at 1.19 million, up 37.4% year on year.
2025 passengers
FAAN conference statement · +11.9% YoY
2025 passengers
FAAN traffic analysis · +5.9% YoY
Domestic passengers
FAAN statement · +10% YoY
Scheduled seats, Sep 2026
OAG capacity · +37.4% YoY
Figure 1. Nigeria aviation traffic and capacity signals, 2025–2026. Source: FAAN-linked statements and OAG. The passenger totals are not silently harmonised because the cited releases conflict.
Those totals do not reconcile neatly. We show them rather than manufacture a reconciliation with a screwdriver and prayer. The direction, however, is difficult to miss: Nigerian aviation is getting busier despite fares that can make Lagos-Abuja resemble a small rights issue.
For ground handlers, more traffic should mean more aircraft turns, bags, cargo and invoices. The interesting question is what survives to the shareholder.
02 · Same runway. Very different income statements.
SAHCO's H1 2026 revenue rose 9.3% to ₦23.01 billion. NAHCO's rose 9.4% to ₦35.36 billion. Their gross margins were both 53.3%. So far, twins.
Then somebody changed the script.
SAHCO's PAT fell 52.7% to ₦3.85 billion. NAHCO's rose 22.2% to ₦10.85 billion. SAHCO administration consumed 28.6% of revenue against 12.5% at NAHCO; PAT margins were 16.7% and 30.7% respectively.
| H1 2026 / current | SAHCO | NAHCO |
|---|---|---|
| Revenue | ₦23.01bn (+9.3%) | ₦35.36bn (+9.4%) |
| Gross margin | 53.3% | 53.3% |
| Admin / revenue | 28.6% | 12.5% |
| PAT | ₦3.85bn (−52.7%) | ₦10.85bn (+22.2%) |
| PAT margin | 16.7% | 30.7% |
| Operating cash flow | ₦7.97bn | ₦7.63bn |
| PPE purchases | ₦6.76bn | ₦0.66bn |
| PPE balance | ₦53.78bn | ₦25.50bn |
| Trailing P/E | 42.5× | 17.4× |
Table 1. Same broad aviation environment, sharply different economics. Source: SAHCO and NAHCO H1 2026 filings; Seven Gates calculations.
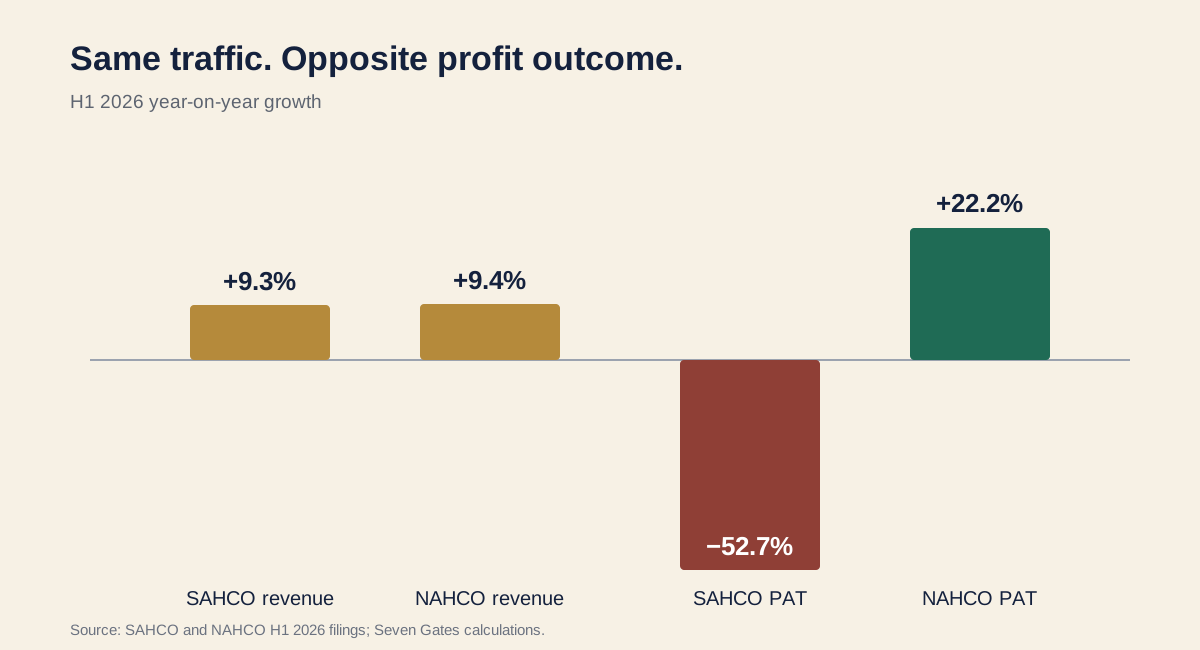
Figure 2. Revenue growth is almost identical. Profit growth is emphatically not.
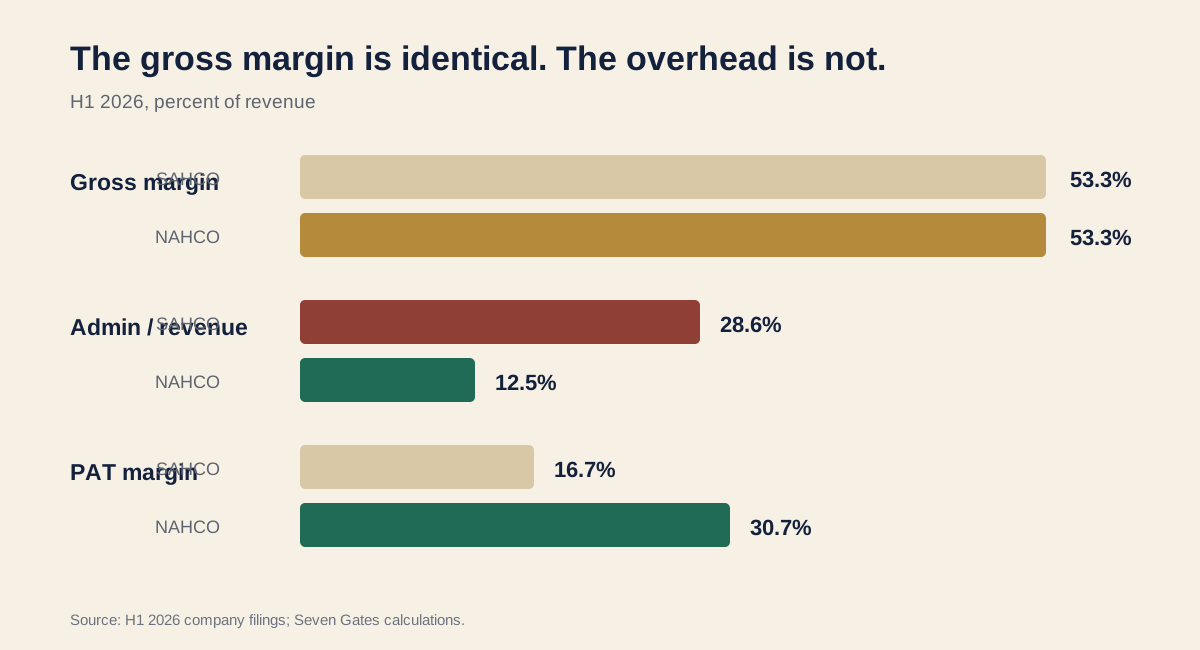
Figure 3. Same gross margin; very different overhead absorption and PAT margin.
SAHCO also carried ₦53.78 billion of PPE, more than twice NAHCO's ₦25.50 billion. It generated ₦7.97 billion of operating cash and spent ₦6.76 billion on PPE. NAHCO generated ₦7.63 billion and spent ₦0.66 billion. Apparently some airport machinery also travels business class.
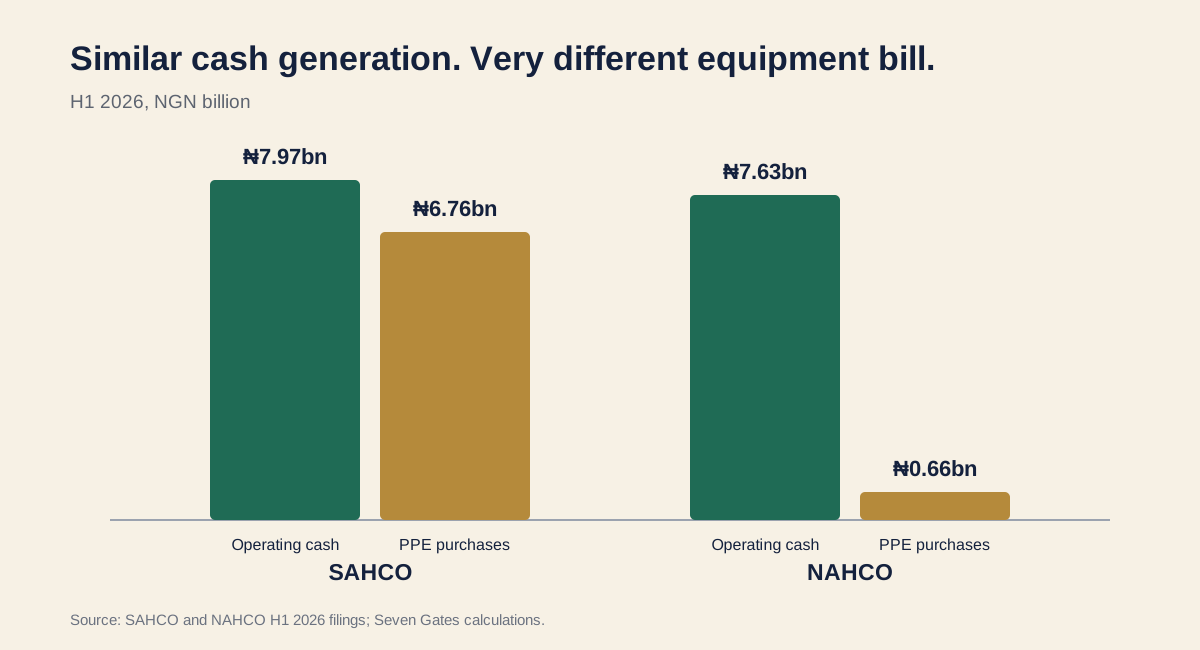
Figure 4. Similar operating cash generation, radically different equipment spend in H1 2026.
The comparison is the argument. If passenger growth alone explained the economics, two handlers exposed to the same broad aviation boom should not produce such different profit outcomes. Revenue growth is virtually identical. Gross margin is identical. The divergence arrives below that line.
03 · The dollar asks to see the receipts.
The naira has been extremely generous to both share-price charts. The dollar, being a more suspicious fellow, asks to see the receipts.
From the 2021 base to 25 September 2026, SAHCO's price return is roughly +3,423% in naira and +992% in dollars. NAHCO's is approximately +7,577% in naira and +2,280% in dollars. Naira depreciation takes an enormous bite, but let us not become melodramatic: a near-tenfold dollar gain is still a near-tenfold dollar gain.
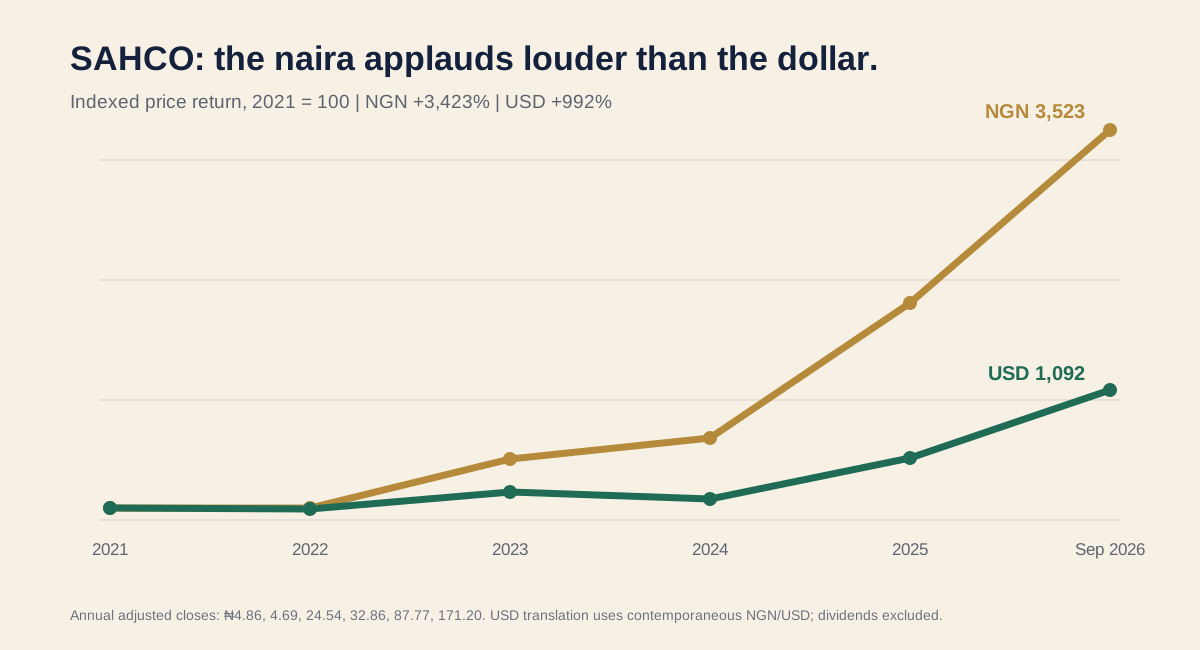
Figure 5A. SAHCO price return, indexed to 100 at the 2021 observation. Annual adjusted closes: ₦4.86, ₦4.69, ₦24.54, ₦32.86, ₦87.77 and ₦171.20.
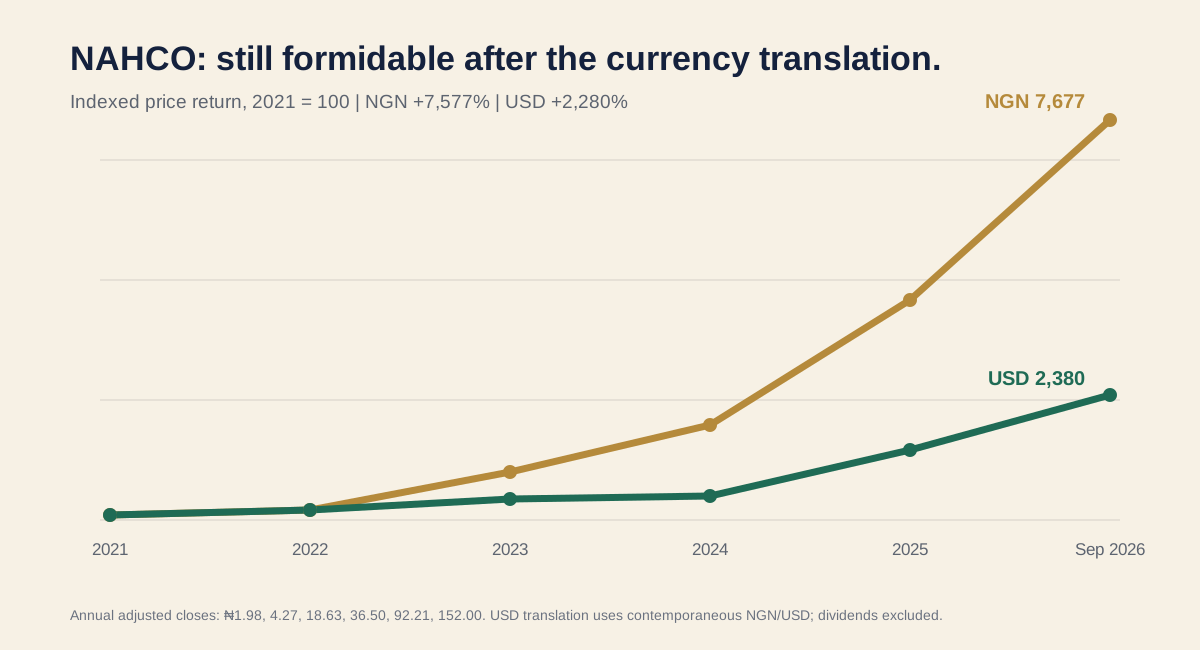
Figure 5B. NAHCO price return, indexed to 100 at the 2021 observation. Annual adjusted closes: ₦1.98, ₦4.27, ₦18.63, ₦36.50, ₦92.21 and ₦152.00.
| Five-year price return* | NGN | USD |
|---|---|---|
| SAHCO | +3,423% | +992% |
| NAHCO | +7,577% | +2,280% |
Table 2. Indexed from the 2021 observation to 25 September 2026. Price return, not total shareholder return; dividends excluded. USD returns translate each equity observation at the contemporaneous NGN/USD rate rather than today's FX rate.
| FX observation | NGN per USD |
|---|---|
| 31 Dec 2021 | 411.95 |
| 30 Dec 2022 | 448.08 |
| 29 Dec 2023 | 896.64 |
| 31 Dec 2024 | 1,549.18 |
| 31 Dec 2025 | 1,446.19 |
| 25 Sep 2026 | 1,329.01 |
Table 3. FX observations used for the USD translation. The series is deliberately date-matched rather than converting the entire history at the latest rate.
For anyone measuring wealth in dollars, school fees in sterling or retirement somewhere the harmattan cannot reach, that second column matters. But it does not overturn the result. FX ate a substantial portion of the optical naira return. It did not eat the investment case whole.
04 · A crowded terminal is not a valuation methodology.
At 25 September, SAHCO at ₦171.20 traded around 42.5× reconstructed trailing earnings. NAHCO at ₦152 was around 17.4×. NAHCO is not obviously cheap at that price, but it has so far done the less theatrical thing and converted the same broad aviation boom into substantially more profit.
| Valuation snapshot | SAHCO | NAHCO |
|---|---|---|
| Price, 25 Sep 2026 | ₦171.20 | ₦152.00 |
| Market capitalisation | ₦231.7bn | ₦338.6bn |
| Trailing P/E | 42.5× | 17.4× |
| H1 PAT margin | 16.7% | 30.7% |
| Five-year USD price return | +992% | +2,280% |
Table 4. Market data dated 25 September 2026; financial metrics from H1 2026 filings and reconstructed trailing fundamentals.
The Nigerian passenger is flying more. SAHCO is earning more revenue. NAHCO is earning considerably more profit. These statements are not contradictory. They are the point.
So we wait on SAHCO. Not because the runway is empty. Because it is full.
The planes will keep landing. The passengers will keep complaining. The bags, by the infinite mercy of Providence and whichever carousel has not broken down, may eventually arrive.
But a crowded terminal is not a valuation methodology.
Sources and methodology
SAHCO H1 2026 NGX filing; NAHCO H1 2026 company filing; FAAN statements reported by Punch, Nairametrics and Vanguard; OAG September 2026 scheduled-capacity data; NCAA/Air Peace disruption reporting; S&P Global Market Intelligence via StockAnalysis; historical USD/NGN observations matched to equity dates. Annual adjusted closes used in the five-year charts are from S&P Global Market Intelligence via StockAnalysis. FX observations: 411.95, 448.08, 896.64, 1,549.18, 1,446.19 and 1,329.01 NGN/USD at the matched dates. The FAAN passenger totals cited above are inconsistent across releases; Seven Gates does not silently reconcile them.
Seven Gates Research is independent research, not investment advice. Figures are reconstructed from public disclosures and may contain rounding differences. Do your own work before committing capital.